When a revenue leader evaluates a PLG CRM, the demo almost always looks impressive, usage dashboards, health scores, activation funnels. The harder question is which of those capabilities will actually hold up once your team is relying on the system daily to prioritize accounts and forecast expansion revenue. This is a practical buying checklist for revenue leaders, CROs, VPs of Revenue, Heads of RevOps, evaluating a PLG CRM, focused on what actually matters after the demo is over.
Most vendor demos are built to be impressive in an hour. They rarely reveal how the tool behaves once it’s loaded with your actual, messy usage data and your team is checking it every day under real pressure to hit a number. This checklist is meant to help you evaluate against that longer bar instead of the polish of the pitch.
Start With Your Activation Definition, Not the Vendor’s
Every PLG CRM vendor will show you their default activation and health-scoring model. Before evaluating any tool, revenue leaders should already have a clear, internally agreed definition of what activation and expansion-readiness actually look like for their specific product. A tool that can’t be configured to your definition and instead forces you into its generic model will produce scores nobody trusts.
This step is easy to skip because it feels like homework that slows down the buying process. In practice, skipping it just moves the problem later: you end up buying a tool, discovering its default scoring doesn’t match how your product actually predicts expansion, and then spending months trying to reconfigure a system nobody agreed on the definitions for in the first place.
What to Actually Evaluate
Once your own activation definition is settled, these five capabilities determine whether a vendor can actually deliver on it.
1. Configurability of Health and Activation Scoring
Can you define your own activation milestones and weight them according to what your data actually shows predicts expansion or churn, or are you stuck with a fixed, generic scoring model? A vendor that can’t answer this concretely, and instead points to a slide of default health tiers, is telling you the scoring will need to be replaced with something custom later anyway.
2. Account-Level Rollup Across Multiple Users
PLG accounts frequently have many individual users at different stages. Confirm the tool aggregates this into a single, trustworthy account view rather than leaving reps to manually piece together user-level data. Ask to see this rollup on a real account with a mix of active and dormant users, not a curated demo account built to look clean.
3. Signal-to-Action Speed
A usage signal that takes days to reach a rep’s queue is far less useful than one that triggers an alert or workflow in near real time. Ask vendors directly how fast a usage event actually becomes an actionable alert, and push past a vague answer like “fast” to get an actual number in minutes or hours.
4. Sales-Assist Handoff Quality
As accounts qualify for human-assisted expansion or enterprise upsell, does the tool preserve full lifecycle context for the rep taking over, or does the handoff lose critical history? A rep should inherit an account’s activation timeline and usage trends automatically, not start the relationship by asking the customer to re-explain how they’ve been using the product.
5. Forecasting Built for Expansion Revenue, Not Just New Business
Many CRMs still forecast primarily around new-logo pipeline. For PLG companies, expansion and net revenue retention are often the bigger revenue lever, so confirm the tool’s forecasting model actually accounts for this rather than treating expansion as an afterthought bolted onto a traditional pipeline report.
Red Flags to Watch For
These signals tend to surface during the evaluation itself, if you know to look for them, rather than waiting until after the contract is signed.
A fixed, non-configurable health scoring model presented as one-size-fits-all
Usage data that syncs into the CRM on a delay of a day or more
No clear way to see a rolled-up account view across multiple individual users
Weak or bolted-on forecasting for expansion revenue specifically
Reference customers who can’t show real, specific before-and-after metrics
Any single item here is worth a direct follow-up question rather than an automatic disqualification. Two or more together, especially a rigid scoring model paired with reference customers who can’t cite specific results, usually points to a tool that will underperform its demo once real data and real pressure are applied to it.
Evaluation Checklist
Use this table as a working scorecard across vendors, scoring each cell based on a direct, specific answer rather than marketing language.
Criteria
Question to Ask
Configurability
Can we define our own activation milestones and scoring weights?
Data latency
How quickly does a usage event become a visible signal in the CRM?
Account rollup
Does the tool show a unified account view across all users?
Handoff quality
What context transfers when an account moves to sales-assist?
Expansion forecasting
Does forecasting explicitly model expansion and renewal, not just new logos?
Involve the Team That Will Actually Use It
Revenue leaders sometimes evaluate PLG CRM tools in isolation from the reps and CS managers who’ll use them daily. Before finalizing a decision, have frontline sales and customer success staff run the tool against real accounts, not a sanitized demo environment, their feedback on how trustworthy the health scores feel in practice is often more predictive of long-term adoption than anything in a sales pitch.
This step also surfaces problems a leadership-level demo tends to miss entirely. A rep working ten accounts a week will notice within a single session whether a health score consistently matches what they already know about an account, or whether it feels disconnected from reality often enough that they’ll quietly stop trusting it.
The Real Test Is Six Months In, Not the Demo
The PLG CRM tools that deliver lasting value are the ones revenue leaders can still trust after six months of real usage, when scores are configured to actual data, signals are fast enough to act on, and the forecasting model reflects how the business actually makes money. Evaluate against that bar, not the polish of the initial demo.
A useful practice is to write down, before the contract is signed, what you’d expect to see six months in if the tool is working: reps trusting the health scores without double-checking them manually, expansion opportunities getting flagged before the customer asks, and a forecast that holds up against what actually closes. Revisit that list at the six-month mark rather than assuming the initial rollout excitement is the same thing as long-term success.
Summary
A PLG CRM demo is designed to impress in an hour, which is exactly why it’s the wrong bar to evaluate against. Revenue leaders should start with their own definition of activation and expansion-readiness, then test any vendor against five specific capabilities: configurable scoring, account-level rollup across multiple users, fast signal-to-action speed, a clean sales-assist handoff, and forecasting that actually models expansion revenue, not just new logos.
Watch for red flags like rigid scoring models, laggy usage data, and reference customers who can’t cite specific results, and involve the reps and CS managers who’ll use the tool daily before finalizing a decision. The real measure of a good PLG CRM is whether your team still trusts it six months in, not how polished it looked in the first demo.
Frequently Asked Questions
What’s the biggest mistake revenue leaders make when evaluating a PLG CRM?
Evaluating the tool against the vendor’s default activation and scoring model instead of an internally agreed definition of what activation and expansion-readiness actually mean for their own product. Without that definition set first, any scoring the tool produces will be difficult for the team to trust.
How configurable should activation scoring be before we commit to a vendor?
It should be fully configurable to your own activation milestones and weighted according to what your own data shows predicts expansion or churn. A fixed, generic scoring model that can’t be adjusted is a strong signal the tool will need to be reworked or replaced once real usage begins.
Why does data latency matter so much for PLG CRM signals?
A usage signal that takes a day or more to reach a rep is much less actionable than one that surfaces in near real time, since the moment a customer shows expansion or churn risk is often the best moment to act on it. Ask vendors for a specific latency number in minutes or hours rather than accepting a general claim of being “fast.”
Should reps and CS managers be involved in the buying decision?
Yes. Frontline reps and CS managers working real accounts every day are often better positioned than leadership to notice whether a health score matches reality or feels disconnected from what they already know about an account. Their feedback tends to predict long-term adoption more reliably than anything shown in a sales pitch.
How does expansion-revenue forecasting differ from typical CRM forecasting?
Typical CRM forecasting is built primarily around new-logo pipeline moving through deal stages. Expansion-revenue forecasting, which matters more for PLG companies where net revenue retention is often the bigger lever, needs to model renewal and expansion likelihood based on usage signals, not just new opportunities moving through a traditional pipeline.
Product-led growth companies have a customer lifecycle problem that traditional CRMs weren’t built for: users sign up and activate long before a salesperson ever talks to them, and by the time a human touches the account, most of the meaningful lifecycle data already lives in the product, not the CRM. Choosing the right CRM tools for a PLG customer lifecycle team means picking systems built around usage data and activation signals, not just contact records and deal stages.
Why Standard CRMs Struggle With PLG Lifecycle Data
Traditional CRMs are built around a linear sales funnel: lead, opportunity, close. PLG lifecycle teams need something closer to a living map of account health across free trial, activation, expansion, and renewal, most of it driven by product usage events rather than sales activity. That mismatch shows up in the same three gaps across nearly every standard CRM.
No native way to ingest product usage or event data as a first-class object
Poor support for tracking multiple users within one account at different activation stages
Weak signal-based alerting for expansion or churn risk based on in-product behavior
None of these gaps look dramatic in isolation, which is exactly why they persist so long. A team can patch around one with a spreadsheet or a Slack channel. Once there are enough self-serve accounts to matter, though, that patchwork becomes someone’s full-time job, and the CRM stops being the system of record it was supposed to be.
What to Look for in CRM Tools for PLG Lifecycle Management
1. Native or Easy Product Usage Integration
The CRM needs to ingest usage data from your product analytics tool, such as Amplitude, Mixpanel, or PostHog, or a CDP like Segment, without heavy custom engineering, so account health reflects actual behavior, not just CRM activity. If every integration requires a developer sprint, the data will always lag behind what’s actually happening in the product.
2. Account-Level Views Across Multiple Users
PLG accounts often have dozens of individual users at different activation stages. Look for tools that roll this up into a single account health view rather than forcing reps to piece it together contact by contact. A rep should be able to see at a glance which users are active, which are stalled, and whether the account as a whole is trending toward expansion or churn.
3. Lifecycle-Stage Automation, Not Just Deal-Stage Automation
Good PLG CRM tooling triggers workflows off product events, a user hitting an activation milestone, a team inviting new seats, usage dropping below a threshold, not just off manually updated deal stages. This is the difference between a system that reacts to what a rep remembers to log and one that reacts to what the customer is actually doing.
4. Sales-Assist Handoff Support
Most mature PLG motions add a sales-assist layer for expansion or enterprise upsell. The CRM needs to support a clean handoff from self-serve to human-assisted selling without losing lifecycle context. A rep picking up an account should inherit its full usage history, not start from a blank contact record and a vague note about why the account suddenly matters.
Tool Categories to Evaluate
Most PLG lifecycle stacks combine several of these categories rather than relying on a single tool to do everything.
Category
Role in PLG Lifecycle
Examples
Core CRM
System of record for accounts, users, and deals
HubSpot, Salesforce, Attio
Product analytics
Tracks usage events and activation milestones
Amplitude, Mixpanel, PostHog
Customer data platform
Unifies product and CRM data into one account view
Segment, RudderStack
PLG-native growth tools
Purpose-built for usage-based signals and expansion triggers
Endgame, Correlated, Pocus
A common pattern is a core CRM for the system of record, a product analytics tool for event tracking, and either a CDP or a PLG-native growth tool sitting between them to translate usage signals into account health and routing decisions.
Signs Your Current CRM Isn’t Built for PLG Lifecycle Work
These patterns tend to show up gradually, which is part of why they’re easy to miss until they’re already costing real deals.
Sales and customer success teams manually re-explain account context to each other because the CRM doesn’t hold it
Expansion opportunities get identified reactively, a customer emails asking for more seats, rather than proactively, usage data flags the account first
Reps rely on spreadsheets or Slack threads to track activation status because the CRM can’t represent it well
If more than one of these sounds familiar, the issue usually isn’t a training gap or a data hygiene problem. It’s the CRM itself not being built to represent how a self-serve product actually generates lifecycle signals.
How to Evaluate a Tool Before Committing
Ask for a live demo using your actual product usage event structure, not a generic sales demo.
Check whether account health scoring is configurable to your specific activation milestones, or a fixed generic model.
Confirm how the tool handles multi-user, multi-role accounts, a common PLG blind spot in older CRM platforms.
Ask current customers running a similar-sized PLG motion how long implementation actually took.
The first step matters more than it looks. A vendor demo built around a generic SaaS trial rarely surfaces the gaps that show up once your actual event data, with all its inconsistencies and edge cases, gets loaded into the system.
The Right Tool Reflects How Your Customers Actually Grow
For PLG companies, the CRM shouldn’t just be a sales tool retrofitted with product data bolted on, it needs to reflect how your customers actually move through activation, expansion, and renewal in the product itself. Prioritize usage-data integration and account-level lifecycle views over traditional deal-pipeline features when comparing options.
Summary
Traditional CRMs are built for a linear sales funnel, while PLG lifecycle teams need a living view of account health across trial, activation, expansion, and renewal, driven mostly by product usage rather than sales activity. The tools worth evaluating should integrate usage data natively, roll multi-user accounts into one health view, trigger workflows off product events instead of deal stages, and support a clean handoff to sales-assist without losing lifecycle context.
Most real stacks combine a core CRM, a product analytics tool, and either a CDP or a PLG-native growth platform to connect the two. Before committing to any option, test it against your own usage event structure rather than a generic demo, and talk to customers running a similarly sized PLG motion about how long implementation actually took.
Frequently Asked Questions
What’s the difference between a CRM built for PLG and a traditional sales CRM?
A traditional sales CRM is built around leads, opportunities, and deal stages driven by rep activity. A PLG-oriented CRM is built around account health across the full lifecycle, trial, activation, expansion, and renewal, driven primarily by product usage signals rather than manually logged sales activity.
Do we need a separate product analytics tool if our CRM claims to support PLG?
Usually, yes. Most CRMs that claim PLG support still rely on a dedicated product analytics tool like Amplitude, Mixpanel, or PostHog to actually capture granular usage events. The CRM’s job is typically to ingest and act on that data, not to replace the analytics layer entirely.
How do we know our current CRM isn’t working for our PLG motion?
Common signs include teams manually re-explaining account context to each other, expansion opportunities getting caught reactively instead of being flagged by usage data first, and reps tracking activation status in spreadsheets because the CRM can’t represent it. If more than one of these is happening regularly, the CRM itself is likely the bottleneck.
What should a PLG CRM demo actually show us?
Ask the vendor to run the demo using your actual product usage event structure rather than a generic sales scenario, and confirm whether account health scoring can be configured to your specific activation milestones rather than relying on a fixed, generic model that may not match how your product actually works.
Is HubSpot or Salesforce good enough for a PLG lifecycle team, or do we need a specialized tool?
It depends on how deeply usage data needs to be reflected in account health and automation. Core CRMs like HubSpot and Salesforce can work well as the system of record, but many PLG teams pair them with a CDP or a PLG-native growth tool like Endgame, Correlated, or Pocus to handle the usage-based scoring and lifecycle triggers the core CRM wasn’t built to do natively.
How long does it typically take to implement a PLG-native CRM?
Implementation time varies significantly based on how clean your existing usage event data is and how many systems need to connect. Rather than relying on a vendor’s stated timeline, ask current customers running a similarly sized PLG motion how long their implementation actually took, since that tends to be a more reliable estimate than the sales pitch.
Product-led growth changed how SaaS companies acquire customers, but for years, the CRM software supporting those companies didn’t change with it. PLG CRM software is the category that’s emerged to close that gap: systems built around usage-driven signals and self-serve customer journeys, rather than the traditional linear sales pipeline. This guide covers what PLG CRM software actually is, why it matters, and how the category has developed heading into 2026.
What Is PLG CRM Software?
PLG CRM software is a category of tools, sometimes a purpose-built platform, sometimes a configuration of a traditional CRM plus supporting tools, designed to track and act on customer behavior across the entire self-serve lifecycle: signup, activation, expansion, and renewal, largely driven by in-product usage rather than sales activity.
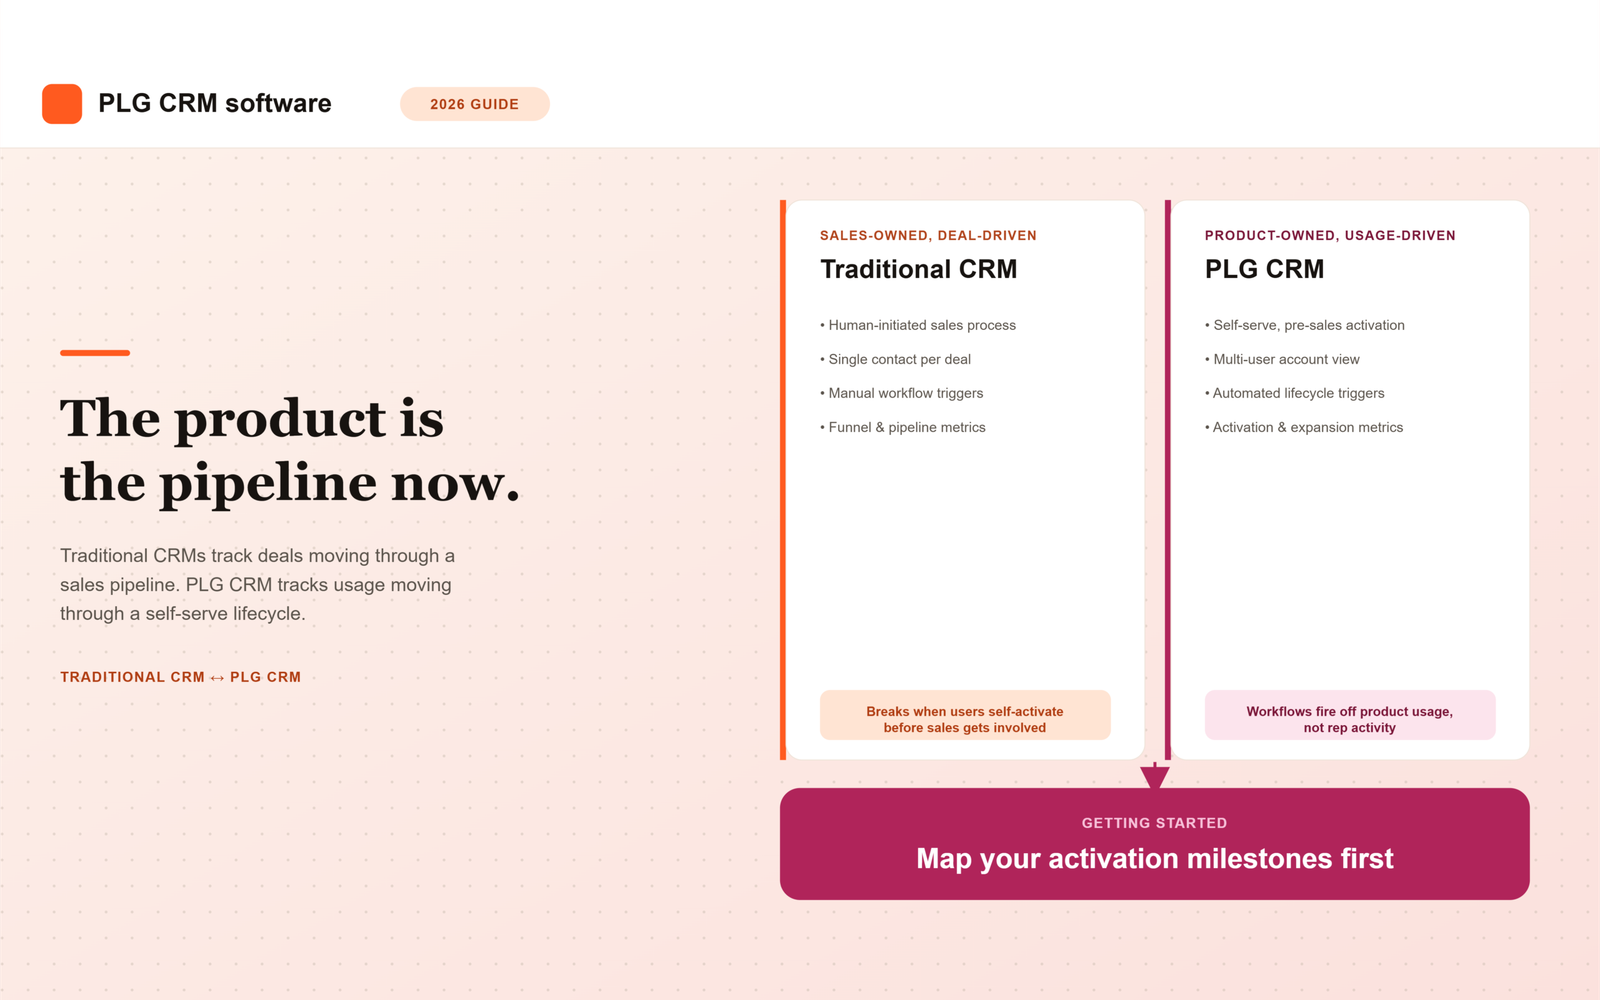
Unlike a traditional CRM, which is built around deals moving through a sales-owned pipeline, PLG CRM software treats the product itself as the primary source of lifecycle data, with sales and customer success acting on signals the product generates rather than driving the process from the start. A user signing up, exploring a feature, inviting a colleague, or hitting a usage limit all become data points the system can act on automatically, long before a rep ever gets involved.
This distinction matters because the underlying assumption behind most CRMs, that a human initiates and drives the sale, simply doesn’t hold for a self-serve product. The account already exists, is already being used, and may already be showing signs of expanding or churning before anyone at the company has spoken to a single user.
Why Traditional CRMs Fall Short for PLG Companies
Most traditional CRMs were designed decades before product-led growth became a standard motion, and the gaps that creates tend to show up in the same four places.
They assume a human-initiated sales process, when in PLG the user often self-activates before any sales contact happens
They’re built around single primary contacts per deal, not the multi-user, multi-role accounts typical of PLG products
They lack native support for triggering workflows off product usage events rather than manually logged sales activity
Reporting defaults to funnel and pipeline metrics rather than activation and expansion metrics that actually matter for PLG growth
None of these gaps are fatal on their own, but they compound. A team can work around any single one with a manual process or a spreadsheet. Once a company has enough self-serve accounts to matter, though, those manual workarounds turn into the full-time job of someone stitching data together that the CRM should have surfaced natively.
Core Capabilities of PLG CRM Software
1. Usage-Based Account Health Scoring
Rather than scoring leads on firmographic data alone, PLG CRM systems weigh product usage patterns, feature adoption, login frequency, seat expansion, to determine account health and expansion readiness. A company with 500 employees that logs in once a month is a worse expansion candidate than a 50-person company where three teams use the product daily, and a good PLG CRM should reflect that in the score rather than defaulting to company size.
2. Multi-User Account Views
Because PLG accounts often have many individual users at different points in the activation journey, the software needs to represent the account as a whole, not just individual contact records. One user might be a power user driving expansion, while three others haven’t logged in since their invite. A single contact record can’t capture that spread, but an account-level view built for multi-user products can.
3. Automated Lifecycle Triggers
Workflows fire based on product behavior, a user hitting an activation milestone, usage dropping below a churn-risk threshold, a team adding new seats, rather than requiring manual updates from a rep. This is where PLG CRM software earns its keep operationally: a sales or customer success rep doesn’t need to remember to check in on an account, the system surfaces the account the moment its behavior changes.
4. Self-Serve to Sales-Assist Handoff
As PLG motions mature, most add a sales-assist layer for larger accounts or enterprise upsell. Good PLG CRM software supports a clean handoff at the right moment, without losing the lifecycle context built up during the self-serve journey. A rep picking up an account should see its full usage history and activation milestones, not just a name and an email address with no context for why the account is suddenly worth a phone call.
How the Category Has Evolved Heading Into 2026
Early PLG companies stitched together product analytics tools, Amplitude or Mixpanel, a CDP like Segment, and a traditional CRM to approximate this functionality. That stitched approach worked, but it required significant engineering investment to keep the pipes between systems running and in sync.
By 2026, purpose-built PLG CRM and growth platforms, such as Endgame, Correlated, and Pocus, have matured enough that many companies are replacing parts of that stitched-together stack with more integrated, purpose-built tooling. At the same time, traditional CRM vendors have added usage-data ingestion and lifecycle automation of their own to compete, narrowing the gap between the two categories in some cases while widening it in others, depending on how deeply each vendor actually built the capability versus bolted it on.
Build vs. Buy: How to Decide
The right approach depends less on company size and more on how much engineering capacity is available to maintain the system once it’s built.
Approach
Best For
Trade-off
Stitched stack (CRM + analytics + CDP)
Teams with strong data/engineering resources wanting full customization
Higher maintenance burden, more integration risk
Purpose-built PLG CRM platform
Teams wanting faster time-to-value without heavy engineering investment
Less customization than a fully bespoke stack
Traditional CRM with PLG add-ons
Teams already standardized on a major CRM wanting incremental PLG capability
May not fully solve multi-user, usage-native lifecycle needs
Teams that already have a data engineering function tend to lean toward the stitched stack, since they can build exactly what they need and already have the capacity to maintain it. Teams without that capacity are usually better served by a purpose-built platform, even with less customization, simply because the alternative is a fragile stack nobody has time to keep working.
Getting Started: A Practical First Step
Rather than starting with a platform search, start by mapping your actual activation milestones, the specific in-product events that reliably predict a user or account will convert, expand, or churn. This step matters more than it sounds like it should, because most teams skip it and go straight to evaluating vendors on feature lists.
Any PLG CRM software you evaluate should be judged first on how easily it can track and act on those specific milestones, not on its feature list in the abstract. A platform with an impressive list of integrations is useless if it can’t surface the one signal, say, a team inviting five new users in a week, that your data already shows predicts expansion.
Summary
PLG CRM software exists because traditional CRMs were built around a human-initiated sales process that doesn’t match how self-serve products actually get adopted, used, and expanded. The core capabilities that matter are usage-based account health scoring, multi-user account views, automated lifecycle triggers, and a clean handoff to sales-assist once an account is ready for it.
Heading into 2026, companies are choosing between a stitched analytics-plus-CRM stack, a purpose-built PLG platform, or a traditional CRM with PLG add-ons, with the right choice depending mostly on available engineering capacity rather than company size alone. Whichever direction a team takes, the starting point should be the same: map your specific activation milestones first, then evaluate any platform against how well it tracks and acts on those exact signals, not against a generic feature list.
Frequently Asked Questions
What’s the main difference between PLG CRM software and a traditional CRM?
A traditional CRM is built around deals moving through a sales-owned pipeline, driven by rep activity. PLG CRM software treats the product itself as the primary source of lifecycle data, tracking usage-driven signals like activation, feature adoption, and seat expansion, with sales and customer success acting on those signals rather than initiating the process.
Do we need to replace our existing CRM to support PLG?
Not necessarily. Some companies add PLG capability to their existing CRM through add-ons or integrations, particularly if they’re already standardized on a major platform. This tends to work best for incremental needs, but it may not fully solve the multi-user, usage-native lifecycle gaps that a purpose-built PLG CRM or a custom stitched stack can address more directly.
What are activation milestones and why should we map them first?
Activation milestones are the specific in-product events that reliably predict whether a user or account will convert, expand, or churn, such as inviting a teammate or completing a key setup step. Mapping these first matters because any CRM platform is only as useful as its ability to track and act on the exact signals that predict outcomes for your product, not a generic list of features.
Should we build a stitched PLG stack or buy a purpose-built platform?
It depends mainly on available engineering capacity. Teams with strong data and engineering resources can build a fully customized stitched stack using analytics tools, a CDP, and a CRM, but that comes with a higher maintenance burden. Teams without that capacity typically get faster time-to-value from a purpose-built PLG CRM platform, even with somewhat less customization.
How does account health scoring work in PLG CRM software?
Instead of scoring based on firmographic data like company size alone, PLG CRM systems weigh actual product usage patterns, including feature adoption, login frequency, and seat expansion, to determine how healthy an account is and how ready it may be for expansion. A smaller account with high daily engagement can score higher than a larger account that logs in rarely.
When should a self-serve account get a sales-assist layer?
There’s no single universal trigger, but common signals include an account approaching usage limits, multiple teams within the same company adopting the product, or a company requesting features like centralized billing or custom contracts that self-serve typically can’t support. Good PLG CRM software should surface these signals automatically, along with the account’s full usage history, so the handoff doesn’t lose the context built up during the self-serve journey.
What Are RevOps KPIs? A Beginner’s List of Metrics That Matter
RevOps KPIs are the specific, shared numbers a revenue operations team uses to judge whether sales, marketing, and customer success are actually working toward one revenue goal. They typically include pipeline coverage, win rate, forecast accuracy, net revenue retention, and customer acquisition cost, tracked together instead of as isolated department scorecards.
If you’ve ever sat in a leadership meeting where sales blames a bad quarter on marketing, and marketing blames it on sales follow-up, you already know why this topic matters. RevOps (short for Revenue Operations) exists to end that finger-pointing by giving every team the same set of numbers to look at. But if you’re new to the function, the sheer list of acronyms (CAC, NRR, LTV, MQL) can feel like its own second language.
This post breaks down what RevOps KPIs actually are, why they’re different from the metrics your sales team already tracks, and which ones a beginner should focus on first.
What Is a RevOps KPI, Exactly?
A key performance indicator (KPI) is a measurable value that shows whether you’re hitting a specific goal. In a RevOps context, that goal is almost always tied to revenue, not just activity.
According to Highspot, revenue operations KPIs are key metrics that RevOps teams track regularly to make sure sales, marketing, and customer success activities align with pipeline health, forecast accuracy, retention, and goals. Notice the phrase “align with.” That’s the whole point. A RevOps KPI isn’t just a sales number or a marketing number, it’s a number that shows how well the departments are working as one system.
If you want the bigger picture of how that alignment actually works day to day, our guide to what RevOps is covers the function from the ground up.
Metrics vs. KPIs: What’s the Difference?
People use “metric” and “KPI” interchangeably, but they’re not quite the same thing. Metrics track what’s happening in your business day to day, things like conversion rates, pipeline value, and how many calls a rep made this week. KPIs, on the other hand, are the smaller set of metrics that are explicitly tied to outcomes and used to judge whether the company is hitting its revenue goals.
Put simply: every KPI is a metric, but not every metric deserves to be a KPI. Honestly, most of the RevOps dashboards we see fail not because the data is wrong, but because someone tried to make all 40 metrics equally important. They aren’t.
Why Do RevOps KPIs Matter?
Measuring performance isn’t a side task for RevOps, it’s close to the core of the job. Research from the Revenue Operations Alliance found that defining and measuring metrics and KPIs is one of the top three activities RevOps professionals undertake, with 89% saying it’s part of their role.
Here’s why that matters for you as a founder or revenue leader. Without a shared scoreboard, sales, marketing, and customer success each optimize for their own local goal. Marketing chases lead volume. Sales chases closed deals. Customer success chases renewals. None of those goals are wrong, but none of them alone tells you whether the business is actually healthy.
Leading vs. Lagging: The Framework Behind Every Good KPI List
Before you pick specific numbers to track, it helps to understand this one distinction. Lagging indicators tell you what already happened, things like revenue, churn, and closed deals. Leading indicators tell you what’s about to happen, like pipeline velocity, conversion trends, and satisfaction scores that are quietly declining.
A dashboard built only on lagging indicators is a rearview mirror. It tells you the crash already happened. A good RevOps KPI list mixes both, so you can see trouble coming and not just read the obituary afterward.
A Beginner’s List of RevOps KPIs
You don’t need forty metrics to start. Based on what actually shows up across most B2B revenue teams, here’s a practical starter list:
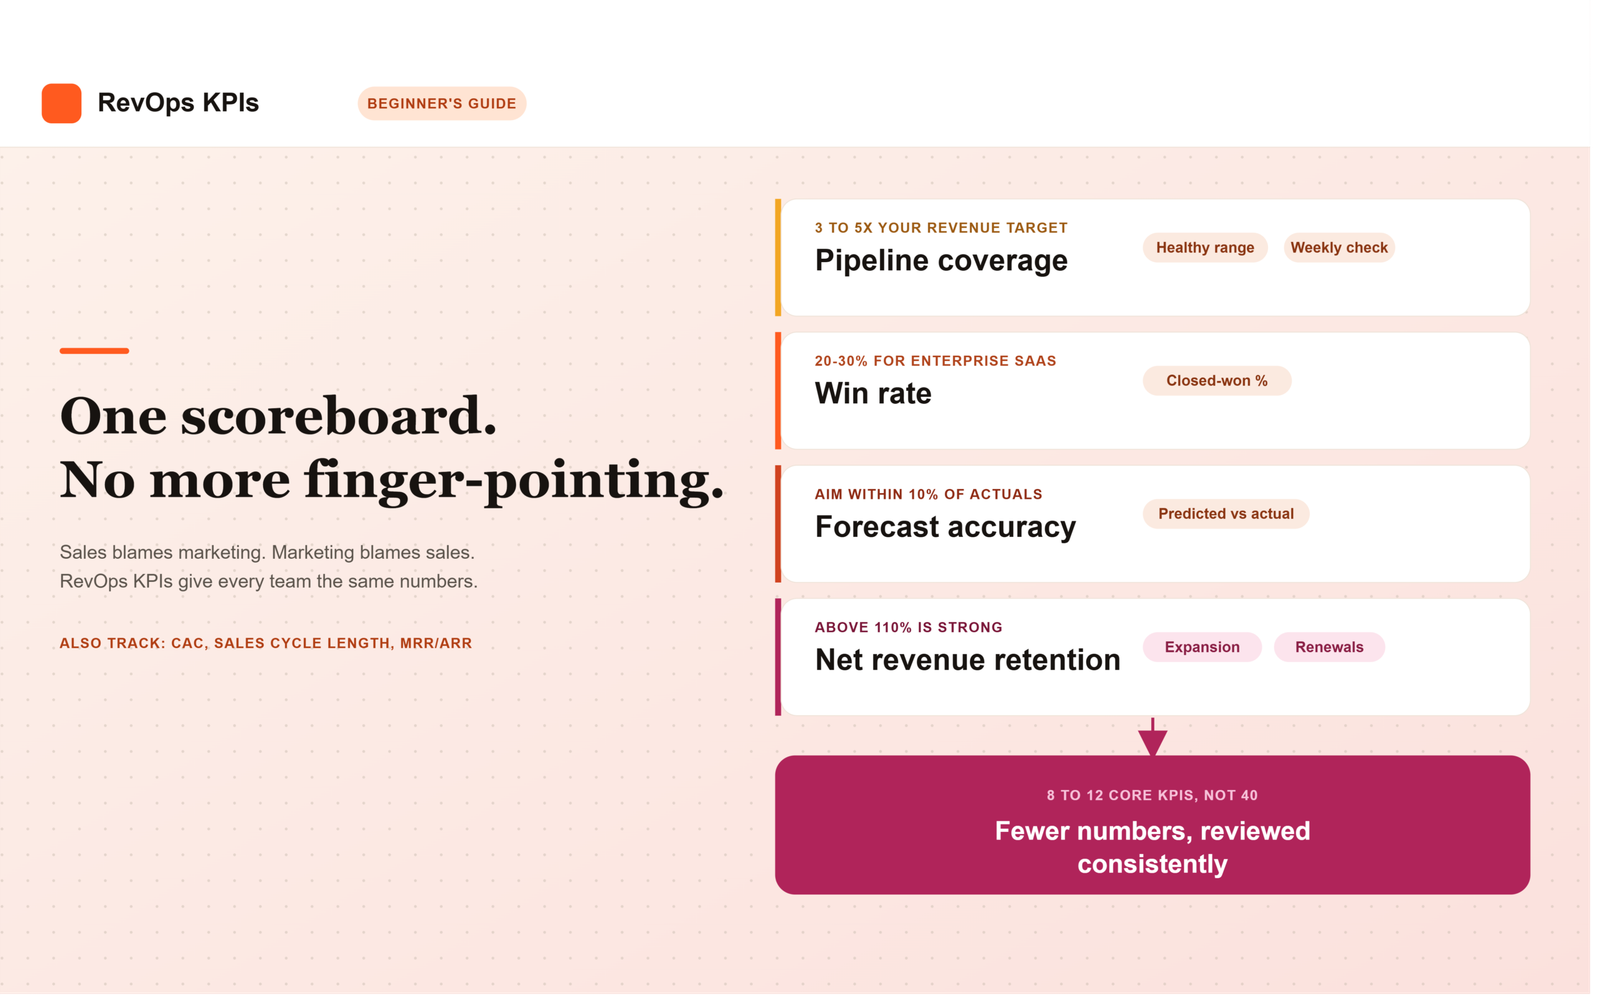
Pipeline coverage ratio, how much open pipeline you have compared to your revenue target. A commonly cited healthy range is around 3 to 5 times your goal.
Win rate, the percentage of opportunities that close as won. Enterprise SaaS deals often land somewhere around 20 to 30%.
Sales cycle length, how long it takes a deal to move from open to closed, which tends to run shorter for SMB deals and considerably longer for enterprise deals.
Forecast accuracy, how close your predicted revenue was to what actually closed. Many RevOps teams aim to stay within about 10% of actuals.
Net revenue retention (NRR), how much revenue you keep and grow from existing customers, with anything above 110% generally considered strong.
Customer acquisition cost (CAC), the total cost of acquiring a new customer, usually made more useful when compared against customer lifetime value (LTV) as a ratio.
MRR/ARR (Monthly/Annual Recurring Revenue), your baseline for measuring current performance and growth over time.
Pro tip: don’t try to report all seven of these plus a dozen more in one weekly meeting. The best RevOps dashboards focus on roughly 8 to 12 core KPIs, not forty.
How Do You Actually Build a RevOps KPI Dashboard?
Pick your two or three headline numbers first. Pipeline coverage, win rate, and forecast accuracy are often the numbers that get checked most consistently at the leadership level.
Add supporting metrics underneath. These feed into the headline numbers rather than competing with them.
Set a review cadence. Revenue operations metrics should generally be reviewed at least monthly, with the most critical ones checked weekly or in real time.
Clean your data before you trust the dashboard. A KPI is only as good as the CRM data behind it.
Revisit the list quarterly. What mattered at 10 employees won’t matter the same way at 100.
Summary
A RevOps KPI is different from an ordinary metric because it’s explicitly tied to whether the whole revenue engine, not just one department, is hitting its goal. The distinction between leading indicators, which warn you something is coming, and lagging indicators, which only confirm what already happened, is what separates a useful dashboard from a rearview mirror.
For a beginner team, the starter list comes down to seven numbers: pipeline coverage, win rate, sales cycle length, forecast accuracy, net revenue retention, CAC, and MRR/ARR. Building a dashboard around them means picking two or three headline numbers first, layering supporting metrics underneath, reviewing on a set cadence, and keeping the underlying CRM data clean enough to trust. The goal isn’t tracking more, it’s keeping everyone looking at the same 8 to 12 numbers instead of forty competing ones.
Frequently Asked Questions
What’s the difference between a RevOps metric and a RevOps KPI?
Metrics are the raw numbers you track day to day, like conversion rate or pipeline value. KPIs are the smaller, selected subset of those metrics that are directly tied to whether you’re hitting your revenue goals.
How many KPIs should a RevOps team track?
Most practitioners land somewhere between 8 and 12 core KPIs. More than that tends to create noise instead of clarity.
Do RevOps KPIs replace sales or marketing metrics?
No, they sit above them. Sales metrics still track individual rep performance, RevOps KPIs look at the big-picture, cross-team numbers that show whether the whole revenue engine is working.
How often should we review RevOps KPIs?
Generally at least monthly, with your most important numbers, like pipeline coverage or forecast accuracy, checked weekly or even in real time.
What’s a reasonable forecast accuracy target for a beginner RevOps team?
Staying within about 10% of your actual results is a commonly cited benchmark worth aiming for as you mature your process.
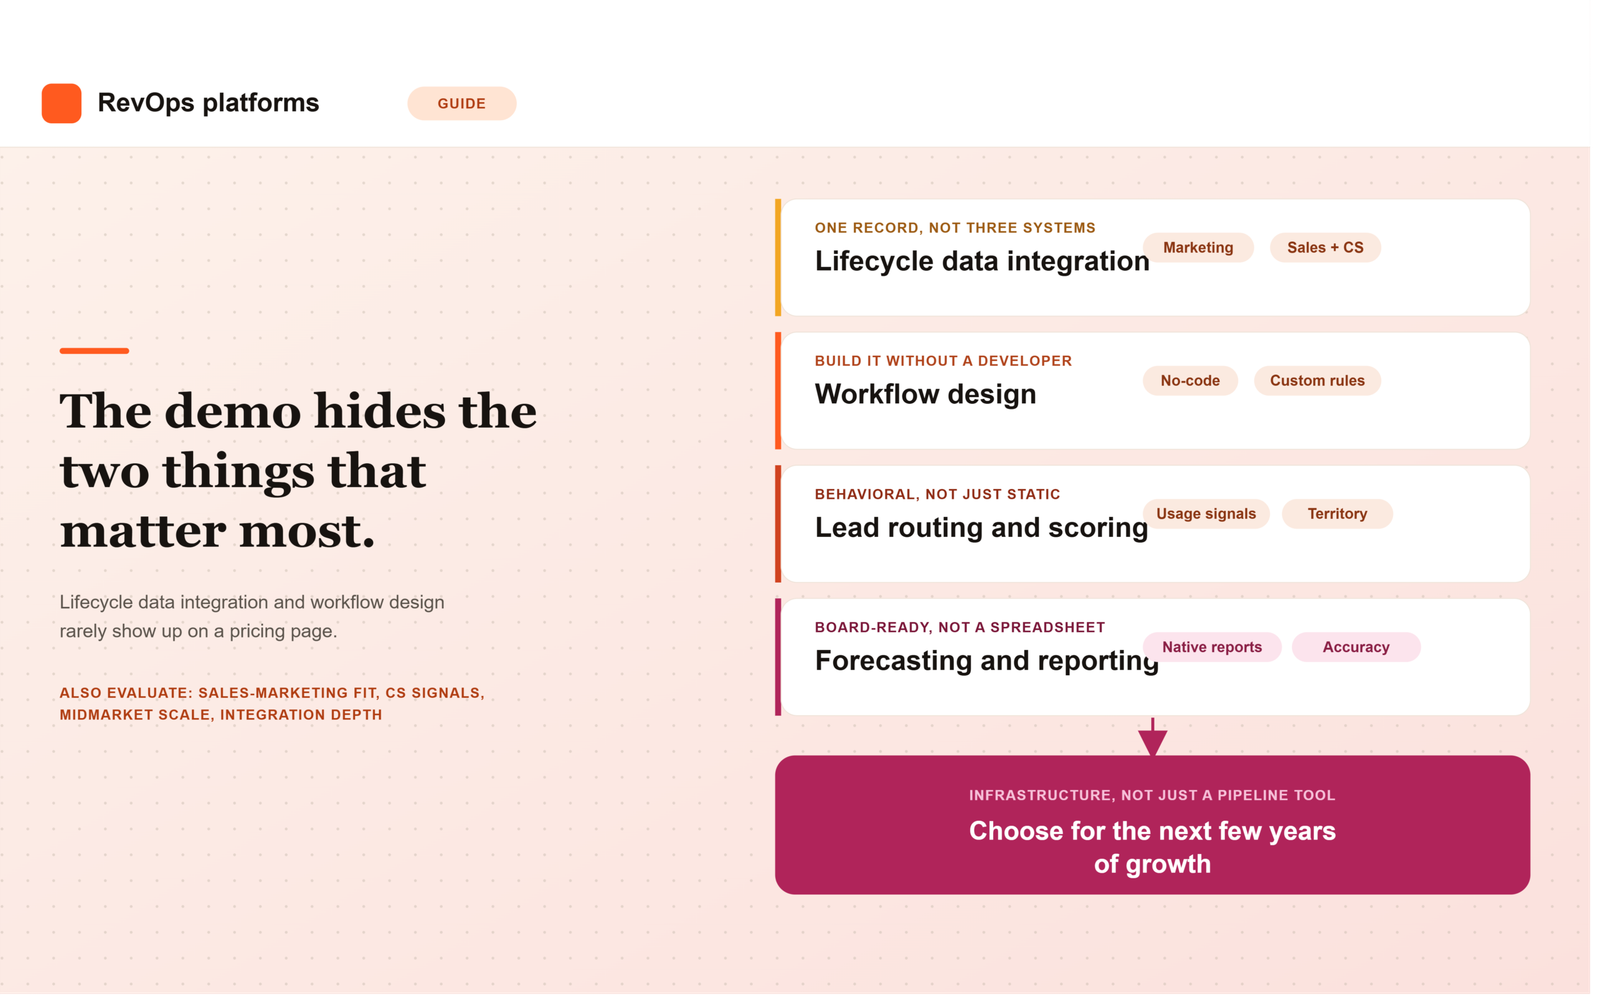
Most comparisons of B2B SaaS CRM and revenue operations platforms focus on the wrong layer. They compare pricing tiers, seat counts, and feature checklists, while the thing that actually determines whether a platform works long term rarely shows up on a pricing page: how well it unifies customer lifecycle data, and how flexibly it lets your team design the workflows that run on top of that data.
A platform can look impressive in a demo and still fail in production if marketing, sales, and customer success data live in three loosely connected systems, or if every process change requires a support ticket to the vendor. This guide breaks down the core capabilities B2B SaaS revenue operations leaders should actually evaluate, with particular attention to lifecycle data integration and workflow design, the two areas where most revenue operations software quietly falls short.
1. Unified Customer Lifecycle Data Integration
Customer lifecycle data integration is the foundation everything else depends on. A B2B SaaS customer generates data across marketing engagement, sales activity, product usage, and support interactions, and a platform that treats these as separate silos forces your team to reconcile them manually every time leadership asks a cross-functional question.
When evaluating a SaaS CRM on this dimension, ask whether marketing engagement data, sales activity, and product usage signals live natively in the same record, or whether they require a separate integration layer to connect. Ask specifically how the platform handles a lead that becomes a customer, then later shows churn risk based on product usage. If tracing that single customer’s full history requires exporting data from three systems, the integration is shallower than the vendor’s pitch suggests.
2. Flexible Workflow Design, Not Just Pre-Built Templates
Workflow design is where a genuine revenue operations platform separates itself from a CRM with automation bolted on. Most platforms ship with template workflows for common processes like lead routing or renewal reminders, which work fine until your business has a rule those templates never anticipated.
Strong RevOps workflow management means your team can build, test, and modify multi-step workflows without needing a developer or a vendor consulting engagement for every change. Ask to see the workflow builder directly during evaluation, not just a slide describing it. Have someone from your own team attempt to build a workflow that mirrors a real process you run today, and see how many steps it actually takes.
3. Native Lead Routing and Scoring
Lead routing and scoring sound like basic features, and most platforms claim to support both. The real question is whether the logic lives natively inside the platform or depends on a third-party add-on that has to be separately licensed and maintained.
Native scoring should weigh behavioral signals such as product usage and engagement, not just static firmographic fields like company size or job title. Ask vendors to walk through exactly how a lead moves from marketing to a specific sales rep, and what happens when routing rules need to change because your territory model changed. If that change requires reconfiguring a separate app rather than adjusting a setting inside the core platform, the routing capability is thinner than it initially appears.
4. Sales and Marketing Automation That Actually Shares Data
Sales and marketing automation frequently exist as two separate products stitched together through an integration, which means definitions drift apart over time. Marketing’s idea of a qualified lead and sales’ idea of a qualified opportunity can end up describing two different things, even though both teams are looking at what they assume is the same data.
A platform built for B2B SaaS revenue operations should let both teams work from shared definitions and shared reporting, not parallel dashboards that require manual reconciliation. Ask the vendor to show a single report tracing a lead from its first marketing touch through to closed revenue, built entirely inside their platform. If that report requires exporting data to a spreadsheet, the alignment gap you’re trying to solve will likely persist regardless of which platform you choose.
5. Customer Success and Retention Signals Built Into the Same System
Retention and expansion depend on customer success signals that many CRM platforms treat as an afterthought, even though recurring revenue businesses depend on them as much as new pipeline. Product usage, support ticket volume, and renewal timing all need to feed into the same system that sales and marketing already use.
When evaluating a platform, ask specifically how it surfaces an account that’s showing early churn risk, and whether that signal reaches the account owner automatically or requires a customer success manager to notice it manually inside a separate tool. A platform that treats retention data as a bolt-on report rather than a native part of the customer record will always lag behind the accounts it should be flagging.
6. Forecasting and Revenue Reporting That Holds Up in a Board Meeting
Forecasting accuracy depends directly on how clean the underlying lifecycle data is, which is why this capability sits so close to data integration on this list. A platform with weak native reporting pushes the real forecasting work onto a RevOps team that then has to rebuild the analysis manually in a spreadsheet every cycle.
Test this directly during evaluation by asking the vendor to reproduce a report your team currently builds by hand, using only their platform’s native reporting tools. If it takes several workarounds or an export to get there, that gap resurfaces every single reporting cycle after the contract is signed.
7. Scalability for Midmarket B2B SaaS Teams Specifically
Midmarket B2B SaaS teams sit in a specific gap: too complex for a bare-bones starter CRM, but without the budget or headcount for a heavy enterprise implementation. A platform aimed at this segment needs to scale with headcount and data volume without forcing a disruptive migration within a couple of years.
Ask vendors directly what breaks first as usage scales, record limits, workflow complexity caps, or reporting performance, and at what size their typical customers outgrow the tier you’re evaluating. Vendors are rarely eager to volunteer this information unprompted, since it points toward a more expensive tier sooner than their sales team would prefer.
8. Integration Depth With Your Existing Stack
Most B2B SaaS teams already run a marketing automation tool, a billing system, and a product analytics platform before they ever evaluate a new CRM. How cleanly a platform connects to that existing stack matters more than how many integrations appear on its marketplace page.
A native, well-maintained integration and a fragile third-party connector can look identical on a features list. The difference only becomes visible once something breaks during a sync, so ask specifically how the integration handles conflicting field updates and what happens when a connected system changes its API.
How to Score These Capabilities When Evaluating Vendors
Rather than treating this list as a generic checklist, build a simple scorecard with these eight capabilities as rows and your shortlisted platforms as columns. Score each cell based on a direct answer or a live demonstration, not marketing copy. Where a vendor cannot answer a specific question concretely, for example, exactly how lifecycle data connects across marketing, sales, and customer success, treat that gap itself as useful information about how the relationship will go after the contract is signed.
The Platform Is Infrastructure, Not Just a Pipeline Tool
The teams that choose well treat a B2B SaaS CRM and revenue operations platform as infrastructure for the next several years of growth, not just a tool for tracking today’s pipeline. Customer lifecycle data integration and flexible workflow design are the two capabilities most likely to be underestimated during a demo, and the two most likely to cause real pain eighteen months after signing if they were.
Frequently Asked Questions
What is customer lifecycle data integration in a RevOps platform?
It means marketing engagement, sales activity, product usage, and customer success signals all live in the same customer record rather than in separate, loosely connected systems. Strong integration lets your team trace one customer’s full history, from first touch through renewal, without exporting data from multiple tools.
Do midmarket B2B SaaS teams need a different platform than enterprise teams?
Often, yes. Midmarket teams need a system that scales for the next few years without a disruptive re-platform, but typically lack the dedicated admin headcount enterprise teams have. The right platform for this stage balances scalability with a workflow builder your existing team can maintain without a certified specialist.
What’s the difference between a SaaS CRM and a full revenue operations platform?
A SaaS CRM typically centers on tracking deals and contacts. A revenue operations platform goes further, natively connecting marketing, sales, and customer success data and supporting the workflow automation that runs across all three, rather than treating pipeline tracking as the only core function.
How important is workflow design compared to out-of-the-box features?
It matters more over time than it does during a demo. Pre-built templates cover common processes, but every company eventually has a rule those templates don’t anticipate. A platform with flexible workflow design lets your team adapt without a developer or a vendor consulting engagement for every change.
Should sales and marketing automation live in the same platform?
Ideally, yes, or at minimum share the same underlying data and definitions. When sales and marketing automation exist as separate products stitched together, lead definitions tend to drift apart, and reporting stops matching between teams even though both are supposedly looking at the same pipeline.
What should we ask vendors specifically about lifecycle data integration?
Ask them to trace one customer’s full history, from first marketing touch through a product usage signal that indicates churn risk, entirely inside their platform. If that requires exporting data to a spreadsheet or switching between separate tools, the integration is shallower than it may have appeared during the initial pitch.
If you’ve ever watched a sales leader announce a huge pipeline number, then watched the quarter close way under target, you’ve seen the problem weighted pipeline is built to fix. Raw pipeline totals lie to you. They treat a deal that just had a first call the same as one that’s ready to sign, and that’s a recipe for false confidence.
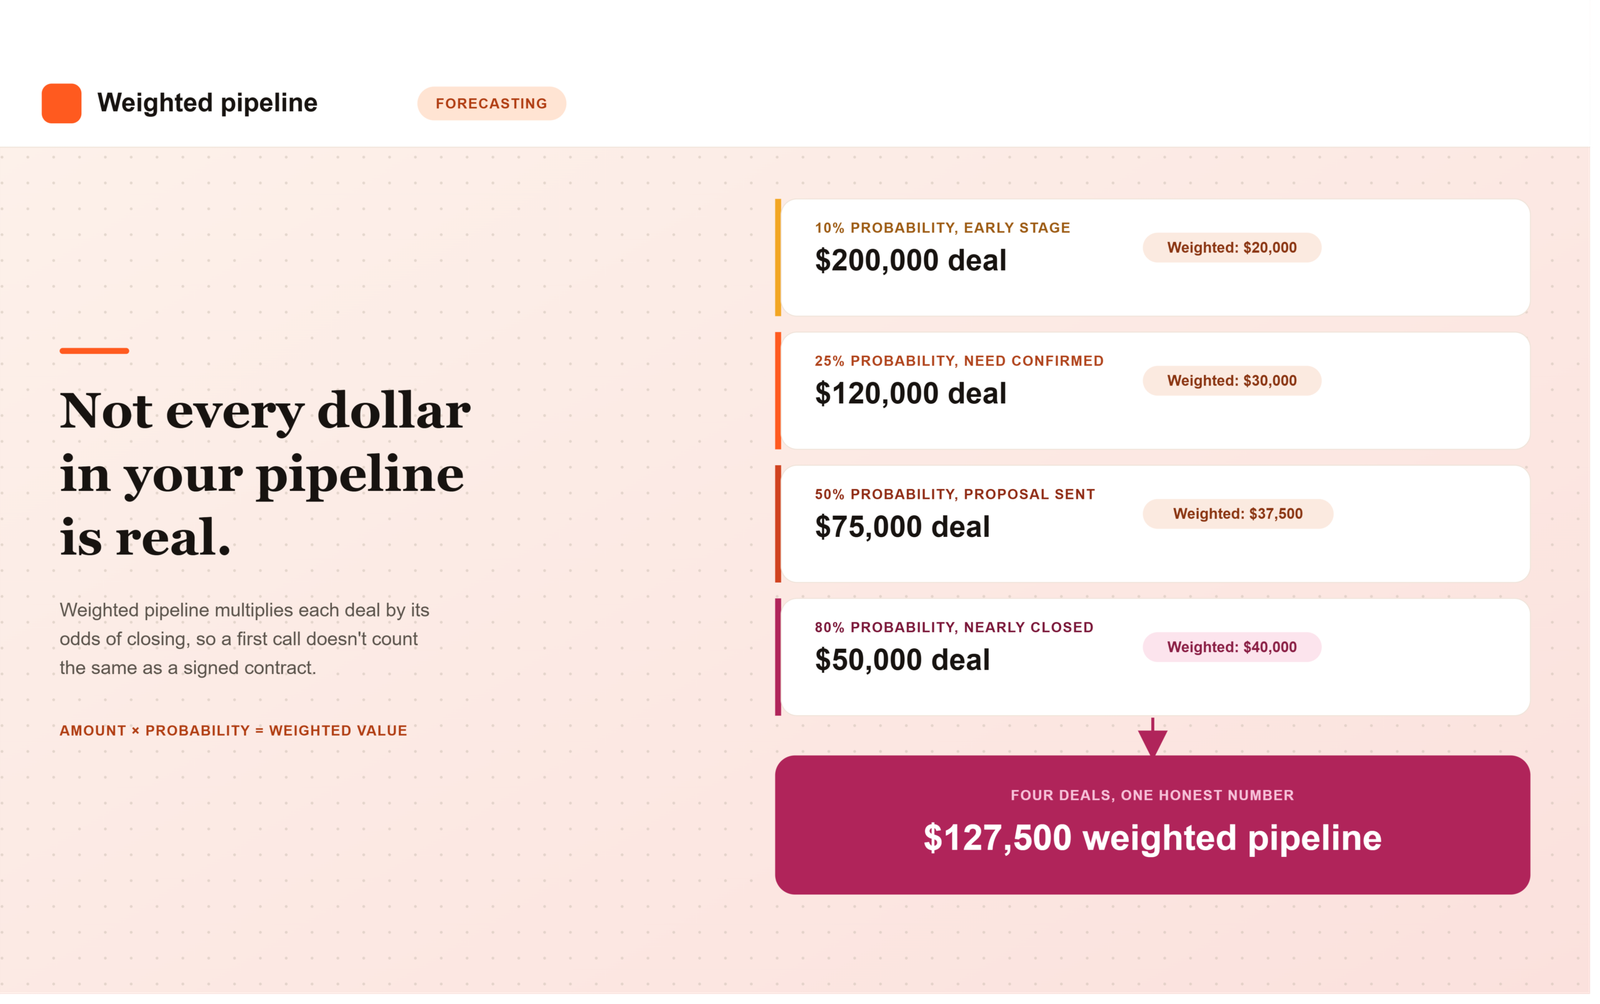
A weighted pipeline is a forecasting method that multiplies each open deal’s value by its probability of closing, then adds up those adjusted numbers. Instead of counting every deal at full value, it shows you what you’ll likely actually collect, based on how far along each opportunity really is.
What Is a Weighted Pipeline, Exactly?
Let’s back up and define a few terms first, since none of this makes sense without them. A sales pipeline is the list of open deals, called opportunities, that your reps are working, usually organized by stage, like “discovery,” “proposal sent,” or “contract negotiation.” A weighted pipeline takes that same list and adjusts it for reality.
Instead of assuming every deal will close, it assigns each one a probability based on where it sits in your sales process, then multiplies that probability by the deal’s dollar value. Add up all those adjusted values and you get your weighted pipeline total.
The core idea is that deals further along in the pipeline are more likely to close than deals that just started, so they should count for more in your forecast. A weighted sales pipeline recognizes that not every opportunity results in a sale, and assigns a value to each one based on its position in the sales process.
How Is Weighted Pipeline Different from Unweighted Pipeline?
An unweighted pipeline, sometimes just called “total pipeline,” adds up every open deal at its full value, no matter what stage it’s in. A brand-new $200K lead counts exactly the same as a $200K deal that’s about to sign.
That’s obviously not how real sales works. An unweighted pipeline treats every deal as equally likely to close, whether you just made contact or they’re ready to sign, and that can lead to inflated revenue forecasts if the big deals don’t come through.
Unweighted pipeline still has its uses. It’s fine for capacity planning or lead-gen targets, where you just want to know volume. But when it comes to forecasting actual revenue, weighted pipeline is the more honest number, because it adjusts for close probability instead of assuming everything lands.
If you’re still fuzzy on how pipeline and funnel relate to each other, our post on sales pipeline vs. sales funnel breaks down that distinction in plain terms.
How Do You Calculate Weighted Pipeline Value?
The formula itself is simple, even if getting the inputs right takes some work. The standard formula is Weighted Pipeline = Deal Amount multiplied by Stage Probability, summed across every open deal.
Here’s a worked example using four hypothetical deals at different stages: a $200K deal at 10% probability, a $120K deal at 25%, a $75K deal at 50%, and a $50K deal at 80%. Multiplying each deal by its stage probability and adding the results gives you a weighted pipeline of $127,500, which becomes a reasonable estimate of near-term new bookings.
Here’s how to actually build this for your own team:
Map your sales stages. Write out every stage a deal moves through, from first contact to closed-won.
Assign a close probability to each stage, ideally based on your own historical conversion data rather than a guess.
Multiply each open deal’s value by its stage’s probability to get that deal’s weighted value.
Add up every weighted value across all open opportunities. That total is your weighted pipeline.
Recalibrate regularly. A common recommendation is to compare your weighted forecast against what actually closed each quarter, then adjust your stage probabilities based on the gap.
Pro tip: don’t hand-wave your stage probabilities. If you’re just guessing “discovery is 20 percent, proposal is 50 percent,” you’re not building a forecast, you’re building a nicer-looking version of a guess. Pull actual historical win rates by stage from your CRM. Even a simple lookback at the last four to six quarters of closed deals gives you a far more honest starting point than a probability borrowed from a template or a competitor’s blog post.
Common Mistakes That Wreck a Weighted Forecast
Weighted pipeline only works if the inputs behind it are trustworthy, and a few recurring mistakes quietly break that trust. The most common is letting stage probabilities go stale. A company sets them once during CRM setup and never revisits them, even as the sales motion, product, and market shift underneath those original assumptions.
Another common issue is reps manually overriding probabilities on individual deals based on gut feel rather than actual stage movement. When that happens enough times across a team, the weighted total stops reflecting the sales process and starts reflecting whatever mood the pipeline review was in that week. A third mistake is applying the same probability curve across very different deal types, treating a small self-serve upgrade the same as a large multi-stakeholder enterprise deal, when the two rarely behave the same way as they move through a pipeline.
Weighted Pipeline vs. Other Forecasting Approaches
Weighted pipeline is one forecasting method among several, and most sales organizations end up using it alongside, not instead of, other approaches. A rep’s manual forecast category, commit, best case, pipeline, reflects human judgment about a specific deal. Historical trending looks at how deals of a similar size and type have converted in the past regardless of current stage. Weighted pipeline sits between the two: more systematic than a gut-feel forecast, more current than a purely historical trend line.
More mature revenue operations software increasingly blends all three, layering rep judgment and historical win-rate data on top of stage-based weighting to produce a forecast that’s harder to game and easier to defend in a board meeting. If you’re evaluating a platform partly for its forecasting capability, our guide on what to look for in a B2B SaaS RevOps platform covers what native forecasting and reporting should actually look like before you sign a contract.
Why Weighted Pipeline Matters Beyond the Sales Team
Weighted pipeline isn’t just a sales reporting exercise. Finance uses it to model cash flow and hiring plans. Customer success and implementation teams use it to anticipate onboarding volume a quarter or two out. Marketing uses it to judge whether current pipeline generation is actually on pace to hit the number, rather than just counting raw leads.
This is also where RevOps earns its keep. Someone has to own the stage probabilities, make sure they’re based on real historical data rather than assumption, and recalibrate them as the business changes. Get that ownership wrong, and every team downstream ends up planning against a number that looks precise but was never actually accurate to begin with.
The Bottom Line
Weighted pipeline exists because raw pipeline totals oversell certainty that doesn’t exist yet. By multiplying each deal’s value against a realistic probability of closing, it gives leadership a number that’s less exciting than the full pipeline total, but considerably more likely to actually show up in the bank account. The formula is simple. Getting the probabilities right, and keeping them honest over time, is the real work.
Frequently Asked Questions
What’s a good starting point for stage probabilities if we don’t have historical data yet?
If you’re too new to have reliable historical win rates, start with a conservative curve, something like 10 percent for early discovery, 25 to 30 percent once a deal has a confirmed need, 50 percent at proposal, and 75 to 80 percent once verbal commitment is given. Treat these as placeholders and replace them with real data as soon as you have a few closed quarters to look back on.
How often should we update our stage probabilities?
Most teams review stage probabilities quarterly, comparing what the weighted forecast predicted against what actually closed. If a stage consistently over- or under-predicts close rates by a meaningful margin, adjust the probability rather than waiting for an annual planning cycle to fix it.
Should every deal type use the same probability curve?
Not necessarily. A small self-serve upgrade and a large multi-stakeholder enterprise deal often behave very differently as they move through a pipeline, so applying one universal curve to both can distort the forecast. Many teams build separate probability curves by deal size or segment once they have enough volume to support it.
Can reps manually override a deal’s weighted probability?
Some CRMs allow it, but it’s worth limiting how often this happens. If reps regularly override probabilities based on gut feel rather than actual stage progression, the weighted total stops reflecting your sales process and starts reflecting individual optimism or caution instead, which defeats the purpose of weighting in the first place.
Is weighted pipeline the same thing as a sales forecast?
They’re related but not identical. Weighted pipeline is one input into a forecast, a systematic, stage-based estimate. A full sales forecast often also incorporates rep judgment categories like commit and best case, along with historical trending, to produce a final number leadership actually commits to externally.
Why does weighted pipeline matter to teams outside of sales?
Finance uses it for cash flow and hiring plans, customer success uses it to anticipate onboarding volume, and marketing uses it to judge whether pipeline generation is actually on pace. Because so many teams plan against this number, getting the underlying probabilities right is a shared responsibility, not just a sales metric.
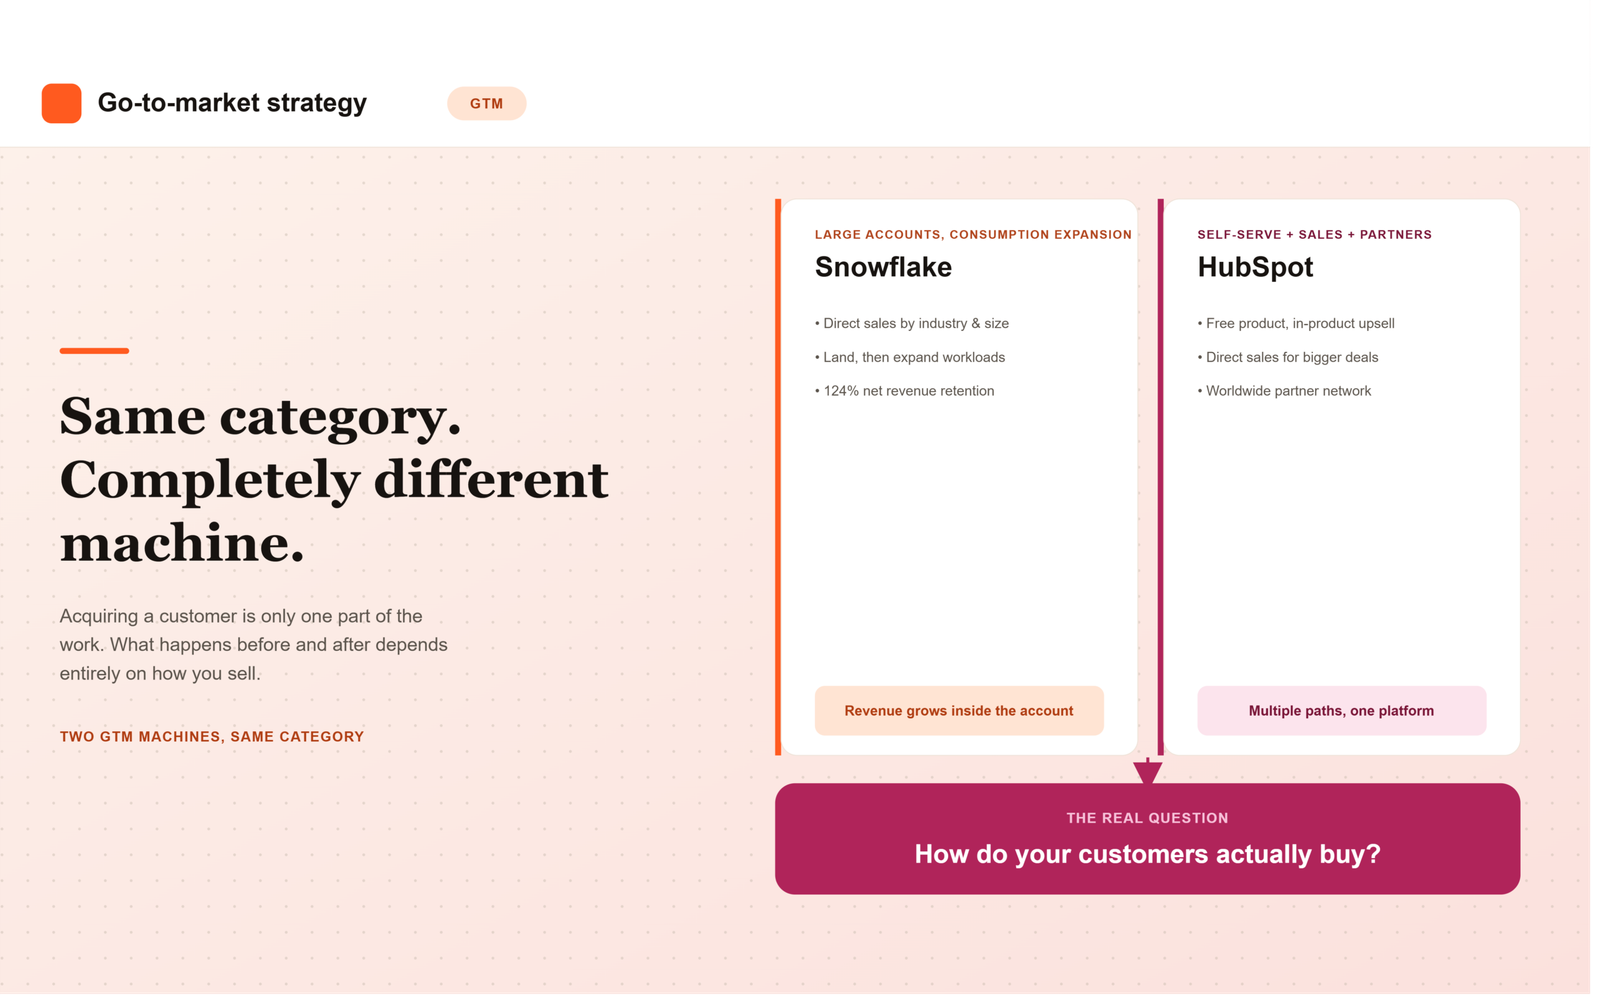
Snowflake and HubSpot both sell business software. A description at that level makes their commercial models sound similar. Their own filings tell a different story.
Snowflake concentrates its selling effort on large organizations, using a direct sales force divided by industry, size, and geography. After a customer starts using the platform, Snowflake works to move additional workloads onto it, which increases consumption and revenue. HubSpot serves companies with between 2 and 2,000 employees through a mix of direct sales, free products customers adopt themselves, in-product offers, and a worldwide partner network. Some customers buy with little or no interaction with a salesperson.
Both companies need customers to discover a product, decide to use it, pay for it, and eventually spend more. The machinery through which that happens is quite different, and that machinery is the subject of go-to-market strategy. GTM determines which customers a company intends to serve, how those customers encounter and buy the product, and how the relationship develops afterward. Acquiring a customer is only one part of the work.
Before a company acquires anyone, it has already made several GTM choices
A sales team cannot pursue “the market.” It has to pursue particular customers. Companies that grow opportunistically, one seller finds a hospital, marketing discovers a segment responds well, end up with a customer base that reflects what the organization happened to win rather than a deliberate choice about where it has an advantage. Scott Edinger framed this in Harvard Business Review as asking whether a company is selling what it intends to sell, to the customers it intends to serve, or simply accepting whatever its sales organization can win.
Different customers create very different commercial requirements. A small company buying a $50 monthly tool can research it online and self-serve. A global bank evaluating a multimillion-dollar system needs months of meetings, security review, procurement, legal, and executive approval, all for a related product category. This is why segmentation, by size, industry, geography, or buying behavior, sits near the beginning of GTM design. Snowflake segments by industry, size, and region toward large organizations; Freshworks serves a broader range through user-led adoption, sales coverage, and partners. These choices ripple into channels, pricing, sales-cycle length, and how much a company can afford to spend winning each account.
Acquisition is really a question of how customers enter the company’s world
Companies often summarize acquisition with a single number, leads or new accounts, but the paths producing those customers may have little in common: advertising, search, outbound email, a conference, a partner, a free product, or a referral. Each path places work in a different part of the organization. HubSpot runs several acquisition systems at once: direct sales, free products, a partner network, and years of inbound content. Freshworks blends user-driven adoption, free trials, sales activity, and partners, designed to reduce friction for new users while keeping sales coverage for larger opportunities.
None of these channels is inherently superior; the economics have to fit the customer and the purchase. Sending a field seller after a $100 annual product makes no sense, and neither does expecting a major bank to buy complex infrastructure through a checkout screen. A 2026 Harvard Business Review article notes that companies increasingly run multiple GTM models at once, citing Microsoft serving small customers digitally while using account teams for large enterprises. The real challenge is deciding which customer enters which path.
Interest has to become a purchase
Acquisition creates attention, not revenue. A person can try a product and disappear; an enterprise buyer can evaluate for months and choose a competitor. Conversion is where interest has to survive the buying process. For simple products, this happens inside the product itself: a user hits a limit, picks a plan, and pays. The questions become familiar to product-led businesses, how fast does a new user reach value, where do people abandon onboarding, which free users eventually pay.
As purchases grow more complicated, salespeople help buyers build an internal case, involve stakeholders, and negotiate terms, though not always in a clean sequence. Amplitude describes combining direct field and inside sales, product-led growth, marketing, and solution consultants, with salespeople working both new accounts and expansion in existing ones. PLG and sales-led motion increasingly operate inside the same customer journey: product creates evidence of demand, and sales becomes useful once the purchase exceeds what self-service can handle. Poor conversion often traces back to the offer itself, confusing pricing, risky commitment terms, painful implementation, not just weak selling.
What happens immediately after the sale affects the GTM model
A signed contract feels like completion, but the customer has only begun trying to receive what it purchased. Recurring-revenue businesses depend on customers continuing to see enough value to remain, which makes the handoff after purchase part of GTM design: who welcomes the customer, what has to be implemented, what commitments made during sales need to reach delivery or Customer Success.
A company can become efficient at winning customers it subsequently loses. Add 1,000 customers in a year and lose 800 existing ones, and the business barely moves while looking busy. Freshworks defines net dollar retention as the revenue change within an existing customer group after upsells, cross-sells, renewals, contraction, and attrition, a measure that forces growth to be viewed through the installed base, not just new logos. Retention problems usually start earlier: a poor-fit sale, an implementation that took too long, features nobody adopted, which is why retention responsibility spreads across Product, Sales, Customer Success, and Support.
Expansion changes the economics of customer acquisition
The first transaction is often only the opening value of a relationship. Snowflake makes this visible through its consumption model: as customers find new use cases and consume more compute and storage, account revenue grows, reporting 124 percent net revenue retention as of April 2025. The mechanism differs elsewhere, a seat-based company expands as headcount grows, a multi-product company cross-sells, a marketplace earns more as participants transact more. Shopify describes revenue from merchants who stay historically growing enough to offset revenue lost from those who leave.
Expansion changes what a company can rationally spend to acquire a customer. Two businesses each spending $1,000 to win an account produce very different economics if one customer pays $1,200 and leaves while the other grows to $5,000 annually over several years. Same acquisition cost, completely different relationship quality, which is why sophisticated GTM organizations spend so much time on customer fit rather than just close rate.
One company can operate several GTM motions
Large companies rarely enforce a single motion everywhere. A small customer and a global enterprise need different channels, sales processes, and economics even on the same platform. Freshworks combines product-led adoption with sales assistance and partners; Atlassian pairs easy product adoption with enterprise cloud as a strategic priority, reporting more than 300,000 cloud customers and 120 percent cloud net revenue retention in fiscal 2025.
A customer can also change motions mid-relationship: a ten-person team’s self-service purchase spreads to 200 employees, IT gets involved, procurement wants a contract, and a product-led account becomes an enterprise opportunity. Missing that transition either leaves expansion revenue on the table or sends expensive sellers after every small signup, destroying the economics that made self-service work in the first place. GTM design has to define the thresholds for when a salesperson, a Customer Success Manager, or a partner gets involved.
GTM strategy is visible in the way resources are allocated
Strategy becomes real once money and people get assigned. “Enterprise healthcare is a priority” means something only once the company hires sellers who understand healthcare, builds the compliance capability buyers expect, and adjusts territories. Otherwise it stays a sentence in a slide deck. The same applies to PLG: a free trial alone doesn’t create product-led growth without accessible onboarding, thoughtful pricing, and product analytics that show when free usage signals willingness to pay. McKinsey frames GTM design in similarly economic terms, deciding whom to sell to, which channels to use, and what coverage each transaction deserves. Resource allocation is what turns GTM from an idea into an operating model.
The funnel is useful, but incomplete
The sales funnel shows that many prospects enter and fewer eventually buy, but it distorts thinking in three ways: customers rarely travel in a straight line, the funnel usually ends at purchase even though much of the value happens afterward, and it makes every prospect look like it’s moving through the same machine, which is increasingly untrue. A lifecycle view captures more of what’s actually happening:
Stage
Commercial Question
Market choice
Which customers are attractive enough to pursue?
Acquisition
How do those customers discover or enter the company?
Conversion
What enables them to move from interest or usage to a purchase?
Onboarding and adoption
How do new customers begin receiving the value they expected?
Retention
What makes the commercial relationship continue?
Expansion
What causes an existing customer to spend more?
Advocacy
Do successful customers help create future demand through references, reviews, referrals, or ecosystem effects?
These rows are connected: poor market selection creates retention problems later, weak onboarding damages expansion, and strong outcomes lower future acquisition costs through referrals. A GTM system behaves differently once these interactions become visible.
GTM is partly a set of economic trade-offs
There is no free acquisition channel. Organic demand looks inexpensive, but brand, content, and time created it. Direct sales adds headcount cost for control and insight. Partners extend reach but take economics and some control. Free products lower the barrier to adoption while creating large populations who may never pay. Each choice carries a cost structure, which is why customer lifetime economics matter alongside growth rate: what it costs to acquire and serve a customer against what that relationship is expected to create. The math is rarely precise enough to dictate strategy alone, but it rules out impossible combinations, an expensive field-sales model can’t indefinitely chase customers whose lifetime value barely covers the seller’s cost.
Go-to-market strategy does not remain fixed
A company’s GTM system changes as the company, product, and market develop. Early on, founders sell directly, hearing objections and adjusting the pitch themselves. A repeatable process appears only once that uncertainty decreases, after which companies add specialist sellers, territories, demand generation, and partners. A self-service company can move into enterprise; an enterprise company can build a digital channel for smaller customers. A June 2026 Harvard Business Review piece argues companies increasingly run multiple GTM models and need distinct digital strategies for each, but the underlying reason predates AI: customers simply differ in how they want to buy, and a good GTM system keeps learning from that rather than assuming the process built three years ago should stay permanent.
What RevOps sees when it looks at GTM
For Revenue Operations, GTM strategy becomes a set of operating assumptions: how many account executives are needed, how many accounts each can cover, how much pipeline is required and where it originates, what conversion rate makes the plan plausible, and how many implementation or Customer Success resources new customers will need. Those assumptions connect the revenue target to the organization expected to deliver it.
HubSpot’s mixed model requires RevOps to see direct sales, freemium conversion, partner-sourced business, and expansion together. Snowflake’s model requires monitoring consumption expansion inside the installed base. A services company needs to connect sales demand with available delivery capacity. This is why copying another company’s GTM dashboard rarely works, the measures that matter come from the specific economics of that model.
A Working Definition
Go-to-market strategy describes how a company turns a chosen market into customers and then develops those relationships economically over time: whom to serve, what channels create demand, how customers evaluate and buy, how they begin using what they purchased, and the mechanisms that support renewal and expansion. Marketing, Sales, Customer Success, Product, Partners, and RevOps all participate, with their relative importance shifting by model. For a self-service product, Product and Marketing carry most of the burden; for an enterprise purchase, Sales dominates; for a consumption business, usage drives expansion.
The most revealing GTM question is therefore rarely “are we sales-led or product-led?” A company can be both. The useful discussion is about the customers a company wants, how those customers actually buy and receive value, and whether the commercial system built around them can produce attractive economics repeatedly. That is the work behind go-to-market strategy.
Frequently Asked Questions
What’s the difference between go-to-market strategy and a sales funnel?
A funnel visualizes how prospects narrow toward a purchase. GTM strategy is broader, covering which customers to serve, how they buy, and how the relationship grows afterward through retention and expansion, well past where a funnel typically ends.
Can a company use more than one GTM motion at once?
Yes, and most established companies do. HubSpot combines direct sales, a free product, and partners; Freshworks blends self-serve adoption with sales coverage for larger deals. A single customer can even move between motions as the account grows.
Why does net revenue retention matter to GTM strategy?
It shows whether existing customer revenue is growing or shrinking after upsells, renewals, and churn. That number changes what a company can rationally spend to acquire new customers, a business where accounts expand significantly, like Snowflake’s, can justify higher acquisition cost than one where customers rarely grow.
How does GTM strategy relate to RevOps?
RevOps translates GTM strategy into operating assumptions: seller headcount, pipeline requirements, conversion rates, and Customer Success resourcing. Different GTM models produce different operating requirements, which is why borrowing another company’s dashboard rarely fits without adapting it first.
When should a self-serve or PLG account get handed to a salesperson?
Common signals include a product spreading to far more users, IT or security asking questions, or procurement requesting a formal contract. Missing that transition either leaves expansion revenue on the table or destroys the low-cost economics that made self-service work.
Why doesn’t copying another company’s GTM dashboard work?
Because the metrics that matter depend on a company’s specific economics. A consumption business tracks workload expansion, a mixed-motion company needs visibility across sales, freemium, and partner channels, and a services company tracks demand against delivery capacity. Borrowing a dashboard built for a different model usually means tracking the wrong things.
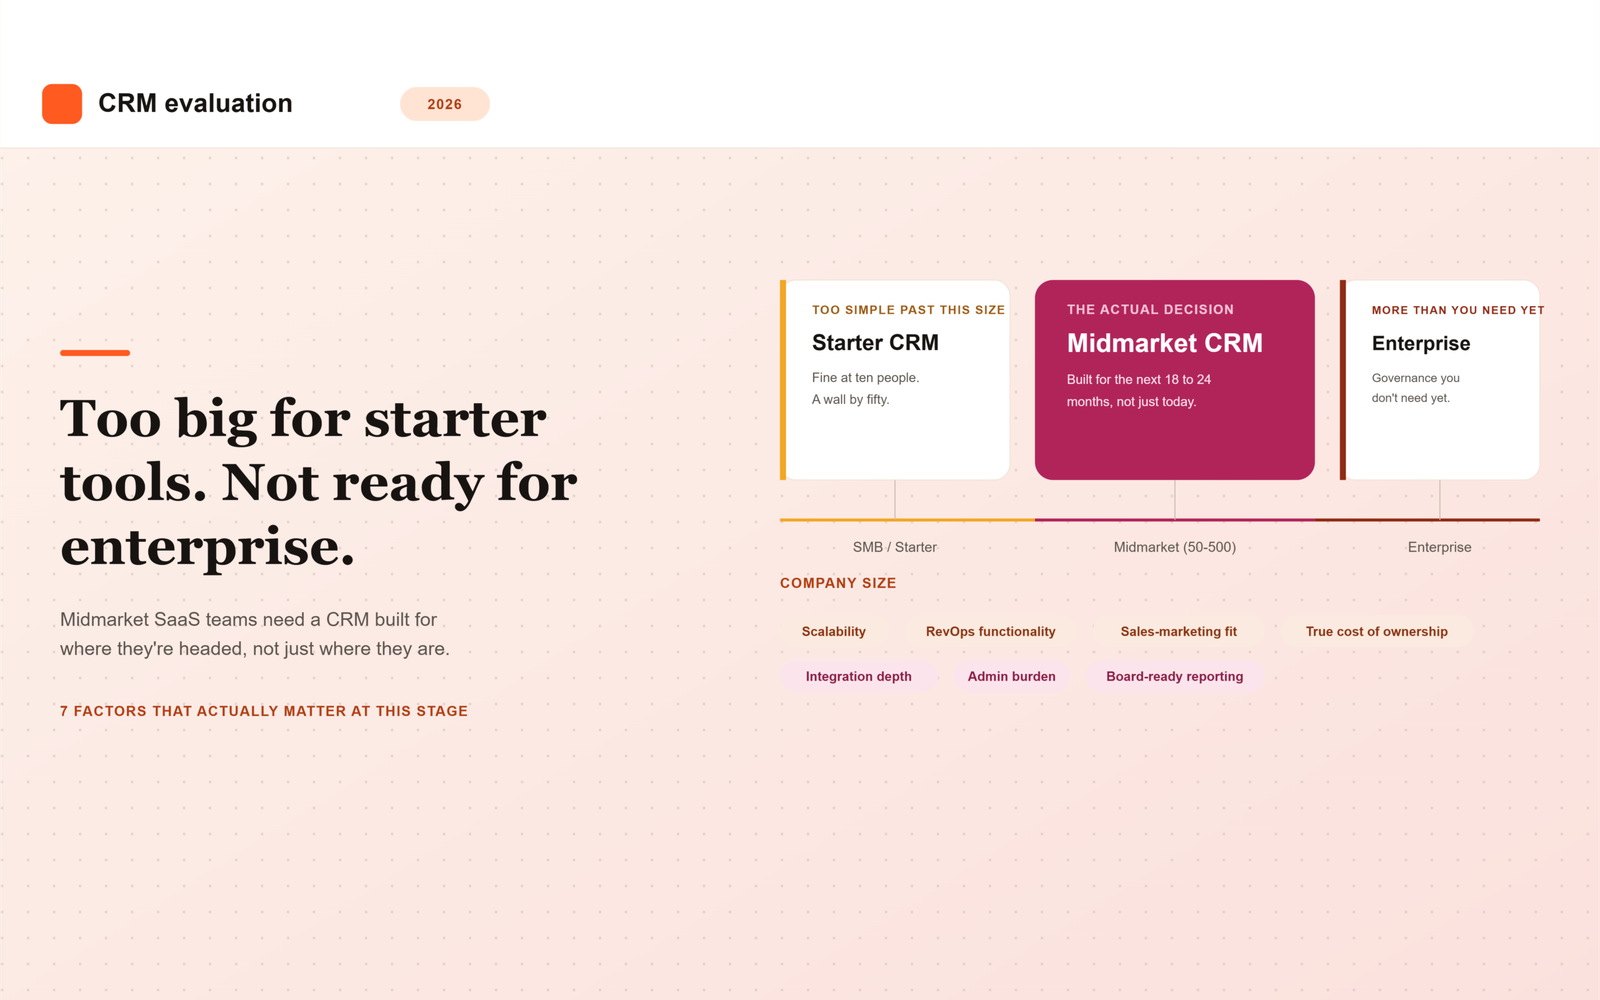
Midmarket SaaS teams sit in an awkward spot when choosing a CRM: too complex for a bare-bones starter tool, but not big enough to justify the cost and overhead of a fully customized enterprise implementation. Getting the choice right in 2026 comes down to a specific set of factors that matter more at this stage than at either end of the company-size spectrum.
Most CRM comparisons are written for one of two audiences: early-stage founders picking their first system, or enterprise buyers running a formal RFP process. Midmarket teams end up borrowing advice from both, and neither fits particularly well. A checklist built for a five-person sales team ignores the reporting and alignment problems that show up once you have fifty reps. A checklist built for a Fortune 500 rollout assumes a dedicated admin team and a budget that most midmarket companies simply do not have.
This guide covers the seven factors that matter specifically at midmarket scale, along with a practical way to score vendors against them.
Why Midmarket Teams Need a Different Evaluation Lens
Early-stage teams optimize for speed and low cost. They need something running by next week, and they can tolerate manual workarounds because the team is small enough to compensate informally. Enterprise teams optimize for customization and governance. They have the budget, the headcount, and the compliance requirements to justify a long, structured implementation.
Midmarket SaaS teams, typically somewhere between 50 and 500 employees, with sales, marketing, and customer success functions that are established but still evolving, need to optimize for something else entirely: a system that scales with them for the next few years without requiring a disruptive re-platform in the middle of a high-growth window.
This is also the stage where problems that were previously invisible start showing up in board meetings. A lead-routing gap that cost a few deals a month at 20 employees costs considerably more at 150. A reporting inconsistency between sales and marketing that nobody noticed before now shows up as two different pipeline numbers in the same slide deck. The CRM decision at this stage is really an infrastructure decision, not just a tool purchase.
The 7 Factors That Matter Most
These seven factors consistently separate a CRM decision that holds up for years from one that forces a painful redo within eighteen months.
1. Scalability Without a Painful Re-Platform
Choose a CRM that can genuinely support two to three times your current headcount and data volume without hitting a wall that forces a full migration. Ask vendors directly what breaks first as usage scales: record limits, automation complexity caps, or reporting performance, and at what company size their current customers typically outgrow the tier you’re considering.
Vendors are often reluctant to volunteer this information directly, since it points customers toward a more expensive tier sooner than the sales team would prefer. Ask for specific examples of customers who outgrew the tier you’re evaluating, and what the migration process actually looked like for them.
2. Native RevOps Functionality, Not Just Sales Pipeline Tracking
By midmarket stage, most teams need real lead routing, scoring, and forecasting capability built in, or easily layered on, not just a pipeline kanban board with a few custom fields. Confirm what’s native versus what requires a third-party add-on and additional cost, since “supports lead scoring” often means “supports it through an app marketplace integration you’ll have to configure and maintain yourself.”
Forecasting accuracy in particular tends to break down at midmarket size, once there are enough reps and enough deal volume that a manager can no longer sanity-check every opportunity by memory. A CRM with weak native forecasting infrastructure pushes that problem onto a RevOps hire who then has to build the missing pieces manually.
3. Sales and Marketing Alignment Features
Midmarket is usually where marketing and sales start actively tripping over each other: overlapping lead ownership, inconsistent MQL and SQL definitions, and reporting that doesn’t match between teams even though both are looking at supposedly the same pipeline. Prioritize CRMs with strong shared reporting and lead-lifecycle management, not just contact records that both teams happen to view separately.
A useful test during evaluation: ask the vendor to show you exactly how a lead is scored by marketing, handed to sales, and tracked through to a closed deal, all inside one report. If that requires stitching together two separate dashboards, the alignment gap you’re trying to solve will likely persist regardless of which CRM you pick.
4. Total Cost of Ownership, Not Just License Price
Per-seat pricing looks manageable at midmarket headcount, but implementation, admin time, and add-on costs, especially for marketing automation and reporting, often double the real cost. Model total cost at your projected headcount 18 to 24 months out, not just today, since the sticker price you’re comparing rarely reflects what you’ll actually be paying once the team and the feature set both grow.
Ask vendors for a realistic total cost breakdown at your projected size, including required add-ons, not just the base license. Several CRMs that look cheaper on the pricing page become more expensive than the alternative once you add the modules midmarket teams typically end up needing within the first year.
5. Integration Depth With Your Existing Stack
Midmarket teams usually already run a marketing automation platform, a billing system, and a customer success tool. Evaluate how cleanly the CRM integrates natively with what you already have, rather than assuming custom integration work will be trivial for your existing team to build and maintain.
A native, well-maintained integration and a fragile third-party connector both show up as “supports integration” on a vendor’s feature page. The difference only becomes obvious once something breaks during a sync, so ask specifically how the integration handles field mapping conflicts and what happens when the connected system changes its API.
6. Admin Burden and Internal Ownership
Midmarket teams rarely have a large dedicated CRM administration function. Choose a platform your existing team, often a single RevOps or sales ops hire, can realistically maintain, rather than one that requires a certified specialist or a consulting partner just to keep running day to day.
This factor gets overlooked most often during evaluation, since demos are run by the vendor’s most experienced solution engineers, not by the person who will actually be configuring workflows six months from now. Ask to see the admin interface directly, and ask how much training a typical new admin needs before they can make changes independently.
7. Reporting That Holds Up in Board and Leadership Meetings
By midmarket stage, leadership expects accurate pipeline coverage, forecast accuracy, and conversion metrics on demand. Confirm the CRM’s native reporting is trustworthy enough for these conversations without requiring manual spreadsheet reconciliation every reporting cycle.
A good test is to ask the vendor to reproduce a report you currently build manually, using only their native reporting tools, live during the demo. If it takes several workarounds or an export to a spreadsheet to get there, that gap will resurface every single board cycle after you’ve signed the contract.
Quick Comparison
The table below summarizes why each factor carries more weight specifically at midmarket scale, compared to either an earlier or later stage.
Factor
Why It Matters Specifically at Midmarket
Scalability
Avoids a disruptive re-platform during a high-growth window
Native RevOps functionality
Pipeline tracking alone is no longer enough at this stage
Sales-marketing alignment
Handoff friction becomes a real revenue leak at this size
True cost of ownership
License price alone significantly understates real cost
Integration depth
Stack is established; poor integration creates daily friction
Admin burden
Most midmarket teams lack a large dedicated admin function
Board-ready reporting
Leadership expectations rise sharply at this stage
How to Use This List When Evaluating Vendors
Rather than treating these as a generic checklist, score each vendor against your specific 18 to 24 month headcount and revenue projections, not just your team’s size today. A CRM that fits perfectly right now but forces a re-platform in eighteen months often ends up costing more, in both dollars and disruption, than choosing slightly ahead of your current needs.
A practical way to run this is to build a simple scorecard with these seven factors as rows and your shortlisted vendors as columns, then score each cell based on direct answers from the vendor rather than marketing copy. Where a vendor cannot answer a question concretely, for example, exactly what breaks first as usage scales, treat that gap itself as useful information about how the conversation will go after you’ve signed.
Choose for Where You’re Headed, Not Just Where You Are
Midmarket is a transitional stage, and the CRM decision should reflect that. The teams that get this right treat the decision as choosing infrastructure for the next phase of growth, not just solving today’s pipeline tracking problem.
The most expensive CRM mistake at this stage is rarely picking a tool that’s too complicated. It’s picking one that looks simple and affordable today, then quietly running out of room exactly when the team can least afford a disruptive migration.
Frequently Asked Questions
How is a midmarket CRM decision different from a startup or enterprise one?
A startup optimizes for speed and low cost, tolerating manual workarounds because the team is small. An enterprise optimizes for customization and governance, with the budget and headcount to support a long implementation. A midmarket team needs something in between: a system that scales for the next few years without a disruptive re-platform, evaluated against admin capacity and total cost, not just feature checklists built for either extreme.
What’s the most common CRM mistake midmarket SaaS teams make?
Choosing based on today’s headcount and today’s license price rather than where the company will be in 18 to 24 months. A CRM that fits perfectly now but hits a scalability wall shortly after often ends up costing more overall, once the disruption of a forced migration is factored in alongside the original savings.
How much should we budget for total cost of ownership beyond the license fee?
There’s no universal number, since it depends heavily on which add-ons your team ends up needing, but implementation, admin time, and required integrations for marketing automation and reporting commonly double the sticker price by the time a midmarket team is fully using the platform. Always ask vendors for a realistic total cost projection at your expected headcount, not just the base license quote.
Do midmarket teams need a dedicated CRM administrator?
Usually not a large dedicated function, but most midmarket teams do need at least one person, often a RevOps or sales ops hire, who can maintain the system without outside help. The right CRM should be realistic for that single person to administer day to day, rather than requiring a certified specialist or ongoing consulting support just to keep it running.
How often should a midmarket team reevaluate its CRM?
There’s no fixed schedule, but it’s worth revisiting the decision whenever the company approaches a major growth inflection, roughly doubling headcount, entering a new market, or adding a significantly different go-to-market motion. Waiting until the system is visibly breaking usually means the migration happens under more pressure and at a worse time than if it had been planned ahead of the wall being hit.
What’s the difference between native RevOps functionality and third-party add-ons?
Native functionality is built directly into the core platform and maintained by the CRM vendor as part of the base product. A third-party add-on is a separate tool, often from the app marketplace, that has to be configured, licensed, and maintained independently, and can break or change pricing without direct coordination with the CRM vendor. Confirming which is which before signing avoids discovering the difference only after something stops working.
“Business model” and “revenue model” get used as if they mean the same thing. A business model describes how a company creates and delivers value to customers. A revenue model describes the specific mechanism a company uses to convert that value into money. Two companies can share the exact same business model and use completely different revenue models to monetize it.
Take two project management tools built for small teams. Same business model, same target customer, same core value. One charges a flat monthly fee per team. The other charges per active user, per month, based on how many people actually log in. Same product, different meter.
Getting this distinction wrong tends to show up later as a pricing problem that is not really about pricing at all. It is a mismatch between how value gets delivered and how the company chose to charge for it. This guide covers the most common revenue models in use today: subscription, usage-based, transactional, services, marketplace, PLG, and enterprise, along with how to tell which one fits your business.
Business Model vs Revenue Model: What’s the Difference
A business model is the bigger picture: who you serve, what problem you solve, and how you deliver that solution. SaaS, marketplace, agency, and hardware are all business models. A revenue model sits underneath that and answers a narrower question: how does money actually change hands?
A single business model can support several different revenue models at once. A SaaS company might charge some customers a flat subscription, charge others based on usage, and negotiate custom enterprise contracts for its largest accounts, all while running the exact same product and the exact same business model underneath. The revenue model is the layer that changes based on the customer, the market, and how value actually gets consumed.
Subscription: Predictable, Recurring Revenue
Subscription pricing charges a fixed, recurring fee, usually monthly or annually, in exchange for ongoing access to a product or service. It is the dominant revenue model in SaaS for a simple reason: it produces predictable, recurring revenue that is easy to forecast and easy to report to a board.
Subscription works best when value is delivered continuously rather than in a single moment. A customer does not buy project management software once and finish using it. They rely on it every day, which makes a recurring fee feel proportionate to the ongoing value they get.
Most subscription businesses layer tiers on top of the base model, separating features, seats, or support levels into Basic, Pro, and Enterprise packages. The metric that matters most here is monthly recurring revenue, or MRR, along with net revenue retention, since subscription businesses live and die by how well they keep and expand existing customers, not just how many new ones they sign.
The weak point of subscription pricing shows up when usage varies wildly between customers. A flat fee undercharges your heaviest users and overcharges your lightest ones, which is exactly the gap usage-based pricing was built to close.
Usage-Based: Pay for What You Consume
Usage-based pricing charges customers according to how much they actually consume: API calls, compute time, messages sent, storage used, or transactions processed. Instead of a flat monthly number, the bill moves with actual activity.
This model has become the default for infrastructure and API-driven products. Companies like Twilio, AWS, and Snowflake all charge this way, largely because it aligns cost directly with the value a customer is getting in that specific month. A customer sending a thousand messages pays less than one sending a million, without anyone having to negotiate a custom tier.
Usage-based pricing also makes it easier to land small and expand naturally. A new customer can start with a tiny footprint and a tiny bill, then grow into a much larger contract as their usage grows, all without a renegotiation. The tradeoff is forecasting difficulty. Revenue depends on customer behavior that is harder to predict than a fixed subscription count, which makes usage-based businesses lean harder on cohort analysis and consumption trends to build a credible forecast.
Transactional: A Fee Per Transaction
Transactional revenue models charge a fee for each discrete transaction or event that flows through the system, rather than a recurring subscription or a usage meter. Payment processors are the clearest example: Stripe and similar companies charge a small percentage plus a fixed fee on every transaction processed, and revenue scales directly with transaction volume.
This model fits businesses where the core value genuinely happens transaction by transaction, moving money, processing an order, completing a booking, rather than through continuous product access. The upside is that revenue grows automatically as customers do more business, without anyone needing to upsell a bigger plan. The downside is that revenue can swing with external factors like seasonality or a customer’s own business volume, which is largely outside your control.
Services: Billing for Human Labor
Services revenue comes from billable hours, fixed-price projects, or ongoing retainers, where the primary value delivered is human expertise rather than software. Consultancies, agencies, and implementation partners run on this model, and it remains common even inside software companies, particularly for onboarding, custom integrations, and enterprise implementation work.
The defining constraint of a services model is that revenue is tied to headcount capacity, not software leverage. A consultancy cannot serve twice as many clients without roughly twice as many consultants, which caps how efficiently the model scales compared to a pure software business.
Many software companies run a blended model on purpose, software revenue for the recurring product and services revenue for the one-time implementation work that gets a customer live. The services piece often exists specifically to reduce the risk of the software piece failing to deliver value fast enough on its own.
Marketplace: A Take Rate on Both Sides
Marketplace revenue models take a commission, often called a take rate, on transactions that happen between two separate parties on a shared platform: buyers and sellers, drivers and riders, freelancers and clients. The platform itself rarely owns the underlying inventory or service; it earns money by facilitating the match and taking a cut of the value that changes hands.
What makes marketplace revenue distinct is that it depends on liquidity on both sides at once. A marketplace with plenty of buyers and no sellers earns nothing, and vice versa, which means growth strategy has to account for both sides simultaneously rather than just acquiring customers the way a typical subscription business would.
Take rates vary enormously by category, from low single digits in categories with thin margins to twenty percent or more in categories where the platform provides significant additional value, like payment handling, trust and safety, or logistics.
PLG: A Motion That Shapes the Revenue Model
Product-led growth, or PLG, is technically a go-to-market motion rather than a revenue model on its own, but it shapes which revenue model actually works. In a PLG motion, the product itself drives acquisition and conversion through a free trial or freemium tier, with little or no sales involvement until later in the customer’s lifecycle.
Because there is no salesperson negotiating a custom deal, PLG companies almost always pair the motion with self-serve pricing, either a simple subscription tier a user can select with a credit card, or usage-based pricing that scales automatically as the account grows. The monetization has to be instrumented directly into the product, since there is nobody manually walking a prospect through a pricing conversation.
The tell that a company is running a genuine PLG motion is not the pricing page, it is whether a user can go from signup to real value without ever speaking to a human being.
Enterprise: Negotiated, Sales-Led Revenue
Enterprise revenue models rely on custom, negotiated contracts closed through a sales-led process rather than a self-serve checkout. Pricing is rarely published, terms are negotiated deal by deal, and contracts often run multi-year with committed spend, custom SLAs, and dedicated support built in.
This model produces a very different shape of business than subscription or PLG: fewer total customers, but a much higher average contract value per account. It also introduces a much longer sales cycle, often stretching across procurement and legal review that a self-serve customer never has to think about.
Many companies that start on subscription or PLG eventually add an enterprise tier once their largest customers start asking for things a standard plan cannot accommodate: custom security requirements, dedicated infrastructure, or contract terms their legal team requires before they can sign anything at all.
How to Choose, or Blend, the Right Model
Most real businesses do not run a single, pure revenue model. They blend two or three: a base subscription plus usage-based overage charges, a subscription plus a one-time services fee for onboarding, or a self-serve PLG tier that graduates into negotiated enterprise contracts once an account grows large enough.
The right starting point is not which model is easiest to bill for. It is how your customer naturally experiences and consumes value. If value is delivered continuously and evenly, subscription usually fits. If value scales directly with volume of activity, usage-based or transactional pricing usually fits better. If the value is mostly human expertise, a services model probably belongs somewhere in the mix, even if the core product is software.
Choosing the wrong model rarely looks like a pricing failure at first. It looks like customers churning for reasons that do not show up in a typical exit survey, or expansion revenue that never quite materializes even though usage is clearly growing. Before assuming your price is wrong, it is worth asking whether your model is.
Frequently Asked Questions
What is the difference between a business model and a revenue model?
A business model describes how a company creates and delivers value, who it serves and what problem it solves. A revenue model describes the specific mechanism used to charge for that value, such as a subscription fee, a usage meter, or a transaction fee. The same business model can support several different revenue models at once.
Can a company use more than one revenue model at the same time?
Yes, and most established companies do. A common blend is a base subscription plus usage-based overage charges once a customer exceeds an included amount, or a self-serve subscription for smaller accounts alongside negotiated enterprise contracts for the largest ones. Blending models lets a company match different customer segments to the pricing approach that fits how each one actually consumes value.
Is PLG a revenue model or a go-to-market strategy?
PLG, or product-led growth, is a go-to-market motion, not a revenue model on its own. It describes how customers discover and adopt a product, largely through a free trial or freemium tier without sales involvement. It usually pairs with a self-serve subscription or usage-based pricing model, since both can be instrumented directly into the product without a salesperson negotiating terms.
Why do SaaS companies eventually add an enterprise pricing tier?
Large customers often need things a standard self-serve plan cannot accommodate: custom security or compliance requirements, dedicated infrastructure, multi-year commitments, or contract terms their legal and procurement teams require before signing. Adding a negotiated enterprise tier lets a company capture that revenue without forcing every customer through the same sales-led process.
How do I know if I picked the wrong revenue model?
The signals rarely look like an obvious pricing complaint. Watch for churn that does not show up as a clear complaint in exit surveys, or expansion revenue that stays flat even though product usage is clearly growing. Both often mean the way you charge does not match how customers actually experience value, which is a model problem, not just a price problem.
What is a take rate in a marketplace revenue model?
A take rate is the commission percentage a marketplace keeps from each transaction that happens between buyers and sellers on its platform. Take rates vary widely by category, from low single digits in thin-margin categories to twenty percent or more where the platform adds significant extra value, such as payment processing, trust and safety, or logistics handling.
Understanding what each function owns and where they overlap
The language around commercial operations has become harder to follow than the underlying work.
A growing company may have Sales Operations, Marketing Operations, Customer Success Operations, Revenue Operations, Deal Desk, Sales Strategy, Business Operations, and several systems or analytics teams working around them. Their job descriptions often use much of the same vocabulary: process, data, systems, planning, forecasting, productivity, automation, reporting.
From the outside, the distinctions can look artificial.
There is a reason for the overlap. These functions did not emerge from a single organizational model. They developed at different times to solve different operating problems, usually inside departments that had become large enough to need specialist support.
Sales Operations came first. Marketing later built its own operations capability as marketing became more dependent on data and technology. Customer Success Operations developed as post-sale work became more structured, particularly in recurring-revenue businesses. Revenue Operations appeared later, partly because companies were finding that the specialist teams could work well inside their own areas while the full customer journey remained fragmented.
It helps to look at that history before trying to draw neat ownership boundaries.
Sales Operations grew around the needs of the sales force
Sales Operations has the longest history of the four. Salesforce traces the formal function to Xerox in the 1970s, when J. Patrick Kelly created a team to handle planning, forecasting, territory design, compensation, and other work required to run an increasingly complex sales organization.
The basic problem has changed less than the technology around it.
Once a company employs more than a small number of salespeople, someone has to decide how accounts should be divided, how many sellers are required, how targets should be allocated, how opportunities are tracked, and how management should interpret the pipeline.
Territories alone can become complicated. A company might divide accounts by geography, industry, size, product, existing relationship, or some combination of these. The design affects hiring, compensation, customer ownership, and the likelihood that good opportunities receive attention.
Forecasting creates another body of work. Sales managers need a common way to describe the status of opportunities. Senior management needs an estimate of likely future sales. Those estimates depend on the quality of the underlying sales process and the discipline with which people maintain it.
GitLab’s public Sales Operations documentation gives a useful picture of the function in practice. Its team works on sales processes, policies, systems, reporting, territories, field support, and go-to-market planning.
This is familiar Sales Ops territory. The team is close to sellers and sales management because most of its work begins with the question of how the sales organization should operate.
That proximity matters. A territory model may look balanced analytically and still fail because experienced sellers know that two apparently similar regions behave very differently. A required opportunity field may improve reporting while making little sense in the actual sales conversation. Good Sales Ops usually requires frequent contact with the people whose work it is organizing.
Some responsibilities move in and out of the function depending on the company. Sales compensation might sit with Finance. Deal Desk may be part of Sales Ops in one organization and RevOps in another. Sales enablement may be closely connected or entirely separate.
There is no standard boundary that every company follows.
Marketing developed a different operating problem
The modern marketing organization produces large amounts of activity and data before a salesperson becomes involved.
A potential customer might attend an event, visit the website several times, subscribe to a newsletter, download a research report, respond to an advertisement, or join a webinar. Each interaction may enter a different system.
Someone has to make those systems usable.
Marketing Operations usually works on the infrastructure behind marketing execution: automation, campaign setup, databases, tracking, lead processes, reporting, and the technology connecting these activities.
HubSpot describes the function broadly around the people, processes, and technology that support marketing strategy, including planning, workflow development, campaign analysis, data management, and performance measurement. GitLab’s Marketing Operations charter places similar emphasis on marketing technology, standardized processes, data quality, and systems management.
The difference from Sales Ops becomes easier to see in day-to-day work.
A Marketing Ops manager might spend time fixing campaign attribution, improving the process for handling webinar registrations, cleaning duplicate contact records, redesigning lead scoring, or deciding how data should move between the marketing automation platform and the CRM.
A Sales Ops manager may use some of the same systems and data while worrying about a different set of questions: account ownership, pipeline quality, seller capacity, or whether a manager’s forecast is realistic.
The distinction is clear enough while the work remains inside each department. It becomes less clear when Marketing decides that a person is ready for Sales.
At that point, the two operating systems meet.
Marketing may have a rule saying that a lead becomes qualified after a certain combination of actions. Sales may discover that the rule generates too many weak opportunities. Marketing Ops can adjust the scoring model, but Sales has information that matters to the change. Sales Ops understands territories and account ownership, which in turn affects where qualified leads should go.
The work is shared because the process itself crosses the departmental boundary.
Customer Success Operations appeared later
Customer Success became a major organizational function much later than Sales or Marketing, particularly with the growth of software subscriptions and other recurring-revenue business models.
In these businesses, the first sale may represent only part of the value of the customer relationship.
A customer needs to begin using the product, adopt it successfully, receive enough value to remain, and eventually decide whether to renew. Some customers expand. Others reduce spending or leave.
Customer Success teams eventually encounter many of the same operating challenges that Sales and Marketing faced earlier.
Accounts need to be assigned. Managers need to understand how many customers each Customer Success Manager can reasonably handle. Onboarding processes need some consistency. Customer information sits in several systems. Renewal dates need to be visible before they become urgent. Leaders want to identify accounts that may be at risk.
CS Ops grew around these needs.
Gainsight describes Customer Success Operations as supporting CS organizations through systems, analytics, process development, and program management. GitLab’s CS Ops team works on customer-success systems, reporting, customer journeys, product-usage analytics, renewals, and operational planning.
Much of the work concerns scale.
A good Customer Success Manager may notice that a particular customer has stopped using an important part of the product and decide to intervene. CS Ops looks across the customer base and asks whether similar signals can be identified systematically.
The team may also help determine which customers should receive high-touch service, which can be supported through more standardized programs, and how renewal activity should be organized.
As with the other functions, these decisions often extend beyond the department itself. Renewal revenue matters to Finance and company forecasting. Expansion may return the customer to Sales. Product-usage information may change how Marketing defines a strong prospective customer.
The customer may be “post-sale,” but the commercial relationship is still active.
Why the boundaries get messy
A diagram of the customer lifecycle makes ownership look straightforward.
Marketing continues to influence existing customers. Customer Success may identify an expansion opportunity that requires a salesperson. Sales may remain involved in a large account long after the original contract is signed. Finance can influence pricing and renewal terms. Product usage can become relevant to both Sales and Marketing.
Even relatively simple processes can require several operations teams.
Suppose Marketing generates an inbound request from a company that is already a customer.
Marketing Ops controls the system that captured the request. Sales Ops may own the rules determining which salesperson handles the account. CS Ops may know that the customer is currently in a sensitive renewal conversation. Sending the request directly to a new-business seller without considering the existing relationship could create an awkward customer experience.
The system needs some way to recognize the situation.
A similar issue appears when territories change. Sales Ops may redesign account ownership at the beginning of the year. Marketing’s routing logic must then reflect the new structure. If it does not, leads continue travelling according to last year’s rules.
Neither function can complete the change entirely on its own.
This kind of overlap occurs repeatedly: lead qualification, lead routing, account ownership, sales handoffs, renewals, expansion, forecasting, and customer data. The difficulty usually comes from different teams having legitimate interests in the same process.
Where Revenue Operations enters
Revenue Operations developed in part because companies needed a broader operating view across these specialist functions.
Forrester’s work on RevOps describes Marketing Operations, Sales Operations, and Customer Success Operations as parts of a wider revenue system and focuses on the coordination of data, technology, processes, and planning across them.
Annual planning shows why that broader view can be useful.
Marketing may expect to generate a certain amount of demand. Sales may plan headcount and territories based on an expected number of opportunities. Customer Success may be preparing for a much larger customer base. Finance has revenue and cost assumptions of its own.
Each team can create a credible plan based on its local information. The problems appear when the assumptions do not line up.
Sales may expect more opportunities than Marketing believes it can produce. Customer Success may need to support a level of growth without the required capacity. Finance may assume a renewal rate that recent customer behavior does not support.
These are the situations in which a RevOps team can be useful. It can bring together assumptions that otherwise live in separate planning processes and help management understand the operating implications of the revenue target.
The same role appears in reporting.
Marketing may report leads and opportunities created. Sales reports pipeline and bookings. Customer Success reports renewals and expansion. Finance has the official financial view.
A management team trying to understand the complete commercial picture needs those measures to connect. RevOps often works on that connection, sometimes through shared definitions, sometimes through common systems, and sometimes simply by bringing the operating teams into the same planning process.
Not every company centralizes this work. Forrester has argued that Revenue Operations can exist as a coordinated capability even when Marketing Ops, Sales Ops, and CS Ops remain separate organizations.
That model is common because the specialist teams still have substantial work that belongs inside their functions.
GitLab shows how the overlap looks in practice
GitLab is useful because its public handbook exposes much of the operating structure that other companies keep internal.
Its Marketing Operations team manages marketing technology, processes, data quality, and systems. Sales Operations focuses on the sales organization, including policies, tools, territories, and sales execution. Customer Success Operations works on customer-success processes, systems, reporting, and renewals.
On paper, these responsibilities can be separated easily.
The handbook itself shows constant interaction between them.
GitLab’s Sales Operations roles include collaboration with Marketing on lead-management processes. Marketing Operations manages systems whose outputs are used elsewhere in the commercial organization. Customer Success Operations works on renewal processes that eventually affect revenue forecasting and account planning.
The teams remain distinct because they need specialist knowledge. The connections remain because customers and customer data move through more than one function.
GitLab also places Sales Operations and Customer Success Operations within a broader Field Operations organization alongside Sales Strategy, Deal Desk, Sales Systems, and Data Intelligence.
That structure is specific to GitLab. Another company might group the same work differently.
The example is useful because it shows that operational design tends to develop around practical needs rather than around perfectly clean definitions.
Ownership is often shared at the edges
Some activities have a natural home.
Sales territory design will usually sit close to Sales Ops. Marketing automation belongs naturally with Marketing Ops. CSM capacity planning is normally a CS Ops concern.
Other activities are harder to place because the consequences spread across functions.
Forecasting is one example.
Sales managers usually produce views of the opportunities they expect to close. Sales Ops supports the process and systems behind those estimates. CS Ops may contribute renewal expectations. RevOps may assemble the broader commercial forecast. Finance may adjust or interpret it for the financial plan.
Several groups can therefore “own forecasting” without doing the same work.
Customer data has the same characteristic.
Marketing needs campaign and engagement information. Sales needs accounts, contacts, opportunities, and pipeline history. Customer Success cares about product usage, customer health, support issues, renewal dates, and outcomes.
A company still needs agreement on basic identifiers and definitions if those records are expected to describe the same customer.
This is where many arguments about organizational ownership become unproductive. The useful level of detail is usually the specific decision being made.
Who decides the sales territory? Who maintains the routing logic? Who defines a qualified marketing lead? Who decides when a customer becomes at risk? Who determines the renewal forecast category? Who can change a customer identifier used across several systems?
The answers may be different even when all of these activities sit inside the same technology platform.
Technical ownership and business ownership are often separate.
A practical view of the boundaries
The following map reflects common patterns rather than fixed rules.
Area of work
Typical operational home
Common overlap
Marketing automation and campaign operations
Marketing Ops
RevOps on shared data and lifecycle rules
Marketing data quality and attribution
Marketing Ops
Sales Ops when measuring conversion into pipeline
Lead qualification
Marketing Ops
Sales Ops and RevOps
Lead and account routing
Sales Ops / Marketing Ops
RevOps when company-wide rules are needed
Territory design
Sales Ops
Finance and RevOps during annual planning
Quotas and seller capacity
Sales Ops
Finance and RevOps
Sales pipeline process
Sales Ops
RevOps for company-wide definitions and reporting
Sales forecasting mechanics
Sales Ops
RevOps and Finance
Sales-to-CS handoff
Sales Ops / CS Ops
RevOps when standardization spans the lifecycle
CSM capacity and customer segmentation
CS Ops
RevOps during company planning
Customer health and CS systems
CS Ops
Product, Sales, and RevOps depending on use
Renewal operations
Often CS Ops
Sales Ops, RevOps, and Finance
Expansion process
CS Ops or Sales Ops
RevOps when ownership crosses teams
Shared customer definitions
RevOps / shared governance
All specialist Ops teams
End-to-end revenue reporting
RevOps
Marketing Ops, Sales Ops, CS Ops, Finance
Revenue capacity planning
RevOps with Finance
All specialist Ops teams
The table becomes inaccurate as soon as it is treated as a template.
A company in which Sales owns renewals will organize renewal operations differently from one in which Customer Success owns them. A channel business may have a large Partner Operations function that changes several of these responsibilities. A small company may place nearly everything in the hands of one Sales Ops or RevOps employee.
The business model usually explains more than the title.
Company size changes the answer
Early-stage companies tend to have blurred operations roles because specialization would create more overhead than value.
The first operations hire may manage Salesforce, prepare board reports, calculate commissions, clean marketing data, fix account assignments, and maintain renewal information. Whether the person’s title is Sales Operations or Revenue Operations often tells us less than the list of work on their desk.
Specialization appears as the volume grows.
Marketing eventually needs dedicated expertise in its technology and data. Sales requires more sophisticated territory, compensation, forecasting, and capacity work. Customer Success needs its own processes and systems as the customer base expands.
The company gains deeper expertise, though coordination becomes harder.
This is one reason RevOps often becomes more visible in later stages of growth. The business now has enough specialized operating teams that somebody has to maintain a view across them.
Sometimes that leads to centralization under one RevOps leader. Sometimes the teams remain separate and share planning, data governance, and systems standards. Some companies use a hybrid arrangement.
The right structure also changes over time. A centralized model can be useful while a company standardizes fragmented processes, then becomes unnecessarily heavy later. A decentralized model can preserve expertise and speed while creating duplicated technology and inconsistent definitions.
Organizational design in this area is rarely permanent.
How to tell whether the boundaries are working
The quality of the structure becomes visible in routine situations.
When Marketing changes the definition of a qualified lead, Sales should understand the consequence before the change goes live.
When Sales redesigns territories, inbound routing should change at the same time.
When a salesperson closes a customer, the post-sale team should receive the information it needs without reconstructing the entire sales history.
When a renewal becomes uncertain, the change should eventually reach the revenue outlook.
Managers should also know where to take a problem. If every cross-functional issue requires escalation to the Chief Revenue Officer, the operating model is probably incomplete. If teams routinely change shared processes without speaking to one another, the model has a different weakness.
Some overlap is healthy. It forces functions to consider consequences outside their immediate department.
The burden comes when the same decision has several owners, or none.
What each function is really there to do
Sales Ops, Marketing Ops, and CS Ops remain useful categories because the departments they support have genuinely different operating needs.
Sales Ops spends most of its time making the sales organization easier to manage and more productive. Marketing Ops builds the systems and processes that allow Marketing to operate at scale. CS Ops provides similar operating support for the post-sale customer organization.
Revenue Operations becomes relevant when the company needs a wider operating view across those functions.
That wider view can involve shared planning, definitions, technology, customer data, lifecycle processes, forecasting, and reporting. The exact scope changes from company to company because the commercial model changes.
There is little benefit in forcing every activity into one universal chart.
A more realistic organization accepts that some work is local, some is shared, and some needs a common owner because several teams depend on the same decision.
That is where the distinctions among RevOps, Sales Ops, Marketing Ops, and CS Ops become useful in practice.
Frequently Asked Questions
What’s the actual difference between RevOps, Sales Ops, Marketing Ops, and CS Ops?
Sales Ops, Marketing Ops, and CS Ops each support one department: sales, marketing, and post-sale customer teams respectively, and grew up solving that department’s specific operating problems. RevOps sits above them, focused on the shared processes, definitions, and reporting that cross department lines, like lead handoffs, forecasting, and renewal visibility.
Which came first: Sales Ops, Marketing Ops, or CS Ops?
Sales Operations has the longest history, tracing back to Xerox in the 1970s. Marketing Operations developed later as marketing became more dependent on data and technology. Customer Success Operations is the newest of the three, emerging alongside the growth of subscription and recurring-revenue business models. Revenue Operations appeared after all three, once companies needed a broader view across specialist teams that were each working well on their own.
Who owns lead routing, Sales Ops or Marketing Ops?
Often both, which is exactly the kind of overlap that causes confusion. Marketing Ops typically controls the system that captures and scores the lead, while Sales Ops owns the rules for which salesperson or team receives it, based on territory and account ownership. When company-wide consistency is needed across both sides of that handoff, RevOps usually gets involved.
Does a company need RevOps if it already has Sales Ops, Marketing Ops, and CS Ops?
Not necessarily as a separate team. Some companies centralize this coordination under a dedicated RevOps function, while others keep Marketing Ops, Sales Ops, and CS Ops separate and share planning, data governance, and systems standards between them. Both models work; what matters is that somebody has responsibility for the decisions that cross departmental lines, like shared customer definitions and end-to-end revenue reporting.
Why do these org structures vary so much between companies?
Because the business model usually explains more than the title does. A company where Sales owns renewals will structure renewal operations differently than one where Customer Success owns them. A channel-based business may have a Partner Operations function that reshapes several other responsibilities. There’s no universal chart that fits every company, only common patterns.
How does company size change how these functions are organized?
Early-stage companies tend to blur these roles into one person handling everything from CRM administration to board reporting, since specialization would create more overhead than value at that size. As volume grows, Marketing, Sales, and Customer Success each need dedicated operating expertise, and RevOps typically becomes more visible at that later stage, once there are enough specialized teams that someone needs to maintain a view across all of them.