What Are RevOps KPIs? A Beginner’s List of Metrics That Matter
RevOps KPIs are the specific, shared numbers a revenue operations team uses to judge whether sales, marketing, and customer success are actually working toward one revenue goal. They typically include pipeline coverage, win rate, forecast accuracy, net revenue retention, and customer acquisition cost, tracked together instead of as isolated department scorecards.
If you’ve ever sat in a leadership meeting where sales blames a bad quarter on marketing, and marketing blames it on sales follow-up, you already know why this topic matters. RevOps (short for Revenue Operations) exists to end that finger-pointing by giving every team the same set of numbers to look at. But if you’re new to the function, the sheer list of acronyms (CAC, NRR, LTV, MQL) can feel like its own second language.
This post breaks down what RevOps KPIs actually are, why they’re different from the metrics your sales team already tracks, and which ones a beginner should focus on first.
What Is a RevOps KPI, Exactly?
A key performance indicator (KPI) is a measurable value that shows whether you’re hitting a specific goal. In a RevOps context, that goal is almost always tied to revenue, not just activity.
According to Highspot, revenue operations KPIs are key metrics that RevOps teams track regularly to make sure sales, marketing, and customer success activities align with pipeline health, forecast accuracy, retention, and goals. Notice the phrase “align with.” That’s the whole point. A RevOps KPI isn’t just a sales number or a marketing number, it’s a number that shows how well the departments are working as one system.
If you want the bigger picture of how that alignment actually works day to day, our guide to what RevOps is covers the function from the ground up.
Metrics vs. KPIs: What’s the Difference?
People use “metric” and “KPI” interchangeably, but they’re not quite the same thing. Metrics track what’s happening in your business day to day, things like conversion rates, pipeline value, and how many calls a rep made this week. KPIs, on the other hand, are the smaller set of metrics that are explicitly tied to outcomes and used to judge whether the company is hitting its revenue goals.
Put simply: every KPI is a metric, but not every metric deserves to be a KPI. Honestly, most of the RevOps dashboards we see fail not because the data is wrong, but because someone tried to make all 40 metrics equally important. They aren’t.
Why Do RevOps KPIs Matter?
Measuring performance isn’t a side task for RevOps, it’s close to the core of the job. Research from the Revenue Operations Alliance found that defining and measuring metrics and KPIs is one of the top three activities RevOps professionals undertake, with 89% saying it’s part of their role.
Here’s why that matters for you as a founder or revenue leader. Without a shared scoreboard, sales, marketing, and customer success each optimize for their own local goal. Marketing chases lead volume. Sales chases closed deals. Customer success chases renewals. None of those goals are wrong, but none of them alone tells you whether the business is actually healthy.
Leading vs. Lagging: The Framework Behind Every Good KPI List
Before you pick specific numbers to track, it helps to understand this one distinction. Lagging indicators tell you what already happened, things like revenue, churn, and closed deals. Leading indicators tell you what’s about to happen, like pipeline velocity, conversion trends, and satisfaction scores that are quietly declining.
A dashboard built only on lagging indicators is a rearview mirror. It tells you the crash already happened. A good RevOps KPI list mixes both, so you can see trouble coming and not just read the obituary afterward.
A Beginner’s List of RevOps KPIs
You don’t need forty metrics to start. Based on what actually shows up across most B2B revenue teams, here’s a practical starter list:
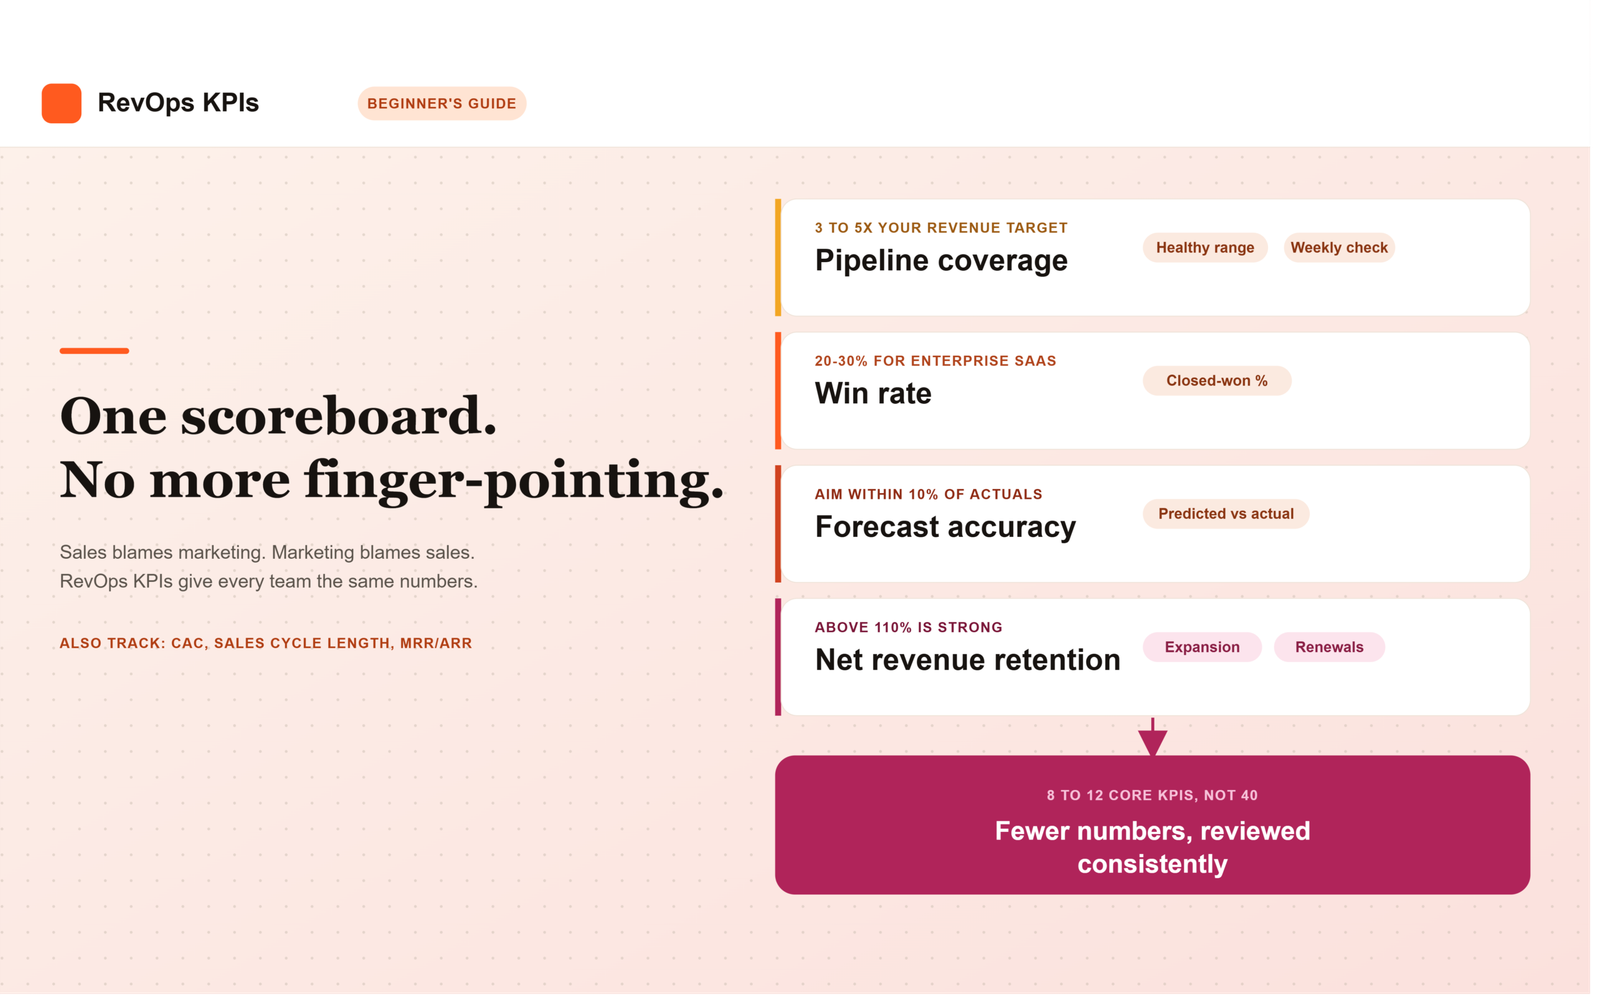
- Pipeline coverage ratio, how much open pipeline you have compared to your revenue target. A commonly cited healthy range is around 3 to 5 times your goal.
- Win rate, the percentage of opportunities that close as won. Enterprise SaaS deals often land somewhere around 20 to 30%.
- Sales cycle length, how long it takes a deal to move from open to closed, which tends to run shorter for SMB deals and considerably longer for enterprise deals.
- Forecast accuracy, how close your predicted revenue was to what actually closed. Many RevOps teams aim to stay within about 10% of actuals.
- Net revenue retention (NRR), how much revenue you keep and grow from existing customers, with anything above 110% generally considered strong.
- Customer acquisition cost (CAC), the total cost of acquiring a new customer, usually made more useful when compared against customer lifetime value (LTV) as a ratio.
- MRR/ARR (Monthly/Annual Recurring Revenue), your baseline for measuring current performance and growth over time.
Pro tip: don’t try to report all seven of these plus a dozen more in one weekly meeting. The best RevOps dashboards focus on roughly 8 to 12 core KPIs, not forty.
How Do You Actually Build a RevOps KPI Dashboard?
- Pick your two or three headline numbers first. Pipeline coverage, win rate, and forecast accuracy are often the numbers that get checked most consistently at the leadership level.
- Add supporting metrics underneath. These feed into the headline numbers rather than competing with them.
- Set a review cadence. Revenue operations metrics should generally be reviewed at least monthly, with the most critical ones checked weekly or in real time.
- Clean your data before you trust the dashboard. A KPI is only as good as the CRM data behind it.
- Revisit the list quarterly. What mattered at 10 employees won’t matter the same way at 100.
Summary
A RevOps KPI is different from an ordinary metric because it’s explicitly tied to whether the whole revenue engine, not just one department, is hitting its goal. The distinction between leading indicators, which warn you something is coming, and lagging indicators, which only confirm what already happened, is what separates a useful dashboard from a rearview mirror.
For a beginner team, the starter list comes down to seven numbers: pipeline coverage, win rate, sales cycle length, forecast accuracy, net revenue retention, CAC, and MRR/ARR. Building a dashboard around them means picking two or three headline numbers first, layering supporting metrics underneath, reviewing on a set cadence, and keeping the underlying CRM data clean enough to trust. The goal isn’t tracking more, it’s keeping everyone looking at the same 8 to 12 numbers instead of forty competing ones.
Frequently Asked Questions
What’s the difference between a RevOps metric and a RevOps KPI?
Metrics are the raw numbers you track day to day, like conversion rate or pipeline value. KPIs are the smaller, selected subset of those metrics that are directly tied to whether you’re hitting your revenue goals.
How many KPIs should a RevOps team track?
Most practitioners land somewhere between 8 and 12 core KPIs. More than that tends to create noise instead of clarity.
Do RevOps KPIs replace sales or marketing metrics?
No, they sit above them. Sales metrics still track individual rep performance, RevOps KPIs look at the big-picture, cross-team numbers that show whether the whole revenue engine is working.
How often should we review RevOps KPIs?
Generally at least monthly, with your most important numbers, like pipeline coverage or forecast accuracy, checked weekly or even in real time.
What’s a reasonable forecast accuracy target for a beginner RevOps team?
Staying within about 10% of your actual results is a commonly cited benchmark worth aiming for as you mature your process.
Leave a Reply