Category: Sales Pipeline Management

  • What Is a Sales Qualified Opportunity? (SQO Guide)

    What Is a Sales Qualified Opportunity? Beginner’s Guide to Qualifying Deals

    Ever looked at your pipeline and wondered why half the “opportunities” in it never had a real shot at closing? You’re not alone. Most B2B teams inflate their pipeline with deals that were never actually qualified, and it wrecks forecasting, wastes rep time, and makes leadership lose trust in the numbers.

    That’s exactly the problem a sales qualified opportunity, or SQO, is meant to solve.

    A sales qualified opportunity (SQO) is a prospect your sales team has personally vetted and confirmed as a real, active deal, not just an interested lead. It has a validated need, budget, decision-making authority, and a clear next step like a demo or proposal already on the calendar.

    What Does SQO Stand For?

    SQO stands for sales qualified opportunity. It’s the stage where a lead officially graduates from “someone who’s interested” to “a deal we’re actively working and forecasting revenue against.”

    A few different glossaries define it slightly differently, but the core idea is consistent. One definition frames it this way: an SQO is a prospect that has been verified as a strong potential customer based on business need, budget, decision-making authority, and purchase timeline. Another puts it more bluntly: it’s a lead that has graduated from “interested” to “actively buying.”

    Here’s the part that matters most for founders new to this: an SQO isn’t just a CRM label you slap on a deal. When an account executive (AE, the rep who owns a deal from qualification through close) marks something as an SQO, they’re making a promise to leadership that this deal belongs in the revenue forecast.

    If you’re still fuzzy on how a pipeline (the visual sequence of deal stages a prospect moves through) differs from a marketing funnel, our post on sales pipeline vs. sales funnel breaks that down before you go further here.

    How Is an SQO Different from an SQL?

    This is where most teams get sloppy, and honestly, it’s the single biggest source of pipeline confusion I see in early-stage revenue teams.

    A sales qualified lead (SQL) is a lead that has been assessed by the sales team and deemed worth engaging, often after showing interest or matching some basic fit criteria. It still requires additional qualification to figure out if there’s real intent, budget, and authority behind it.

    An SQO takes things further. It’s an SQL that has been formally identified as a viable business opportunity, meaning the prospect has a defined need your solution addresses, the budget and authority to make a purchase decision, and the deal has moved into an official sales cycle with a clear next step like a demo, trial, or proposal.

    Put simply: an SQL shows interest. An SQO shows readiness. One is a person who raised their hand. The other is a deal your AE has staked their forecast credibility on.

    A lot of teams also use an in-between stage called SAL (sales accepted lead), which just means an SDR or AE agreed to work the lead, not that it’s been qualified yet. If your org uses SQL, SAL, and SQO interchangeably, that’s usually a sign your pipeline data needs a cleanup, not that your sales team is underperforming.

    What Criteria Make a Deal “Sales Qualified”?

    Most teams don’t invent their own qualification criteria from scratch. They lean on established frameworks, and the most common starting point is BANT.

    BANT stands for Budget, Authority, Need, and Timeline, and it’s a sales qualification framework used to determine whether a lead is a strong fit and likely to move forward in the buying process. Each letter answers a specific question:

    • Budget: Can the buyer realistically fund this solution?
    • Authority: Are you talking to someone who can actually make or influence the decision?
    • Need: Is there a real, confirmed business problem your product solves?
    • Timeline: How soon does the buyer plan to act?

    BANT works well for simpler, transactional deals. For bigger, multi-stakeholder enterprise sales, a lot of teams add or switch to MEDDIC, a framework that stands for Metrics, Economic Buyer, Decision Criteria, Decision Process, Identify Pain, and Champion, each representing an essential part of the qualification process.

    Honestly, most companies don’t need MEDDIC’s full depth on day one. If you’re a small or early-stage team, start with BANT. It’s simpler, faster to teach new reps, and covers 80% of what you actually need to know before calling a deal an SQO.

    Why Does the SQO Stage Matter for Revenue Teams?

    Here’s the problem with skipping this stage: your pipeline becomes a wish list instead of a forecast.

    When companies define and track SQOs consistently, they tend to see improved sales efficiency, higher close rates, and better revenue predictability. That’s not a small thing. Without a defined qualification gate, sales leaders end up forecasting off of gut feel and hope, and finance teams end up asking uncomfortable questions at quarter-end about why so few “opportunities” turned into actual revenue.

    SQOs also give you a genuinely useful metric: your SQL-to-SQO conversion rate. You calculate it by dividing total converted SQOs by total SQLs over a given period, and a healthy B2B benchmark for that rate typically sits between 30% and 50%. If your number is way below that, it usually points to a mismatch between your ideal customer profile and who’s actually filling your top of funnel, not a sales execution problem.

    This is also exactly why the SQO stage matters for forecasting. If you want a deeper look at how these qualified deals actually turn into a revenue forecast, our guide on sales forecasting basics walks through the full process step by step.

    How to Qualify a Deal: A 5-Step Checklist

    If you’re building this process for the first time, keep it simple. Here’s a practical sequence you can adapt:

    1. Confirm a real, two-way conversation happened. A form fill or a voicemail doesn’t count. This needs to be an actual discovery call.
    2. Get the prospect to name their own pain point. If your rep is the one guessing at the problem, the deal isn’t qualified yet.
    3. Verify budget and authority. Ask directly: is there budget allocated, and who signs off on a purchase like this?
    4. Confirm a timeline. When does the buyer actually plan to act, not “someday.”
    5. Lock in a defined next step. A demo, proposal, or trial with a decision-maker invited, already on the calendar.

    Pro tip: Write your qualification criteria down as a short checklist inside your CRM’s opportunity stage, not just in a sales playbook doc. If a rep can’t check every box, the deal doesn’t move to SQO. No exceptions, no “I’ll just mark it anyway to hit my activity number.”

    At Revlyn, this is one of the first things we clean up when we start working with a founder-led sales team: a pipeline full of deals nobody actually qualified, just labeled as opportunities because a call got booked. Fixing the definition alone usually does more for forecast accuracy than any new tool.

    Summary

    A sales qualified opportunity is a deal your sales team has personally vetted, with a validated need, confirmed budget and authority, and a clear next step already scheduled, not just a lead that showed some interest. An SQL shows interest; an SQO shows readiness, and the difference matters because marking something an SQO is effectively an AE staking their forecast credibility on it.

    Most teams qualify deals using BANT (Budget, Authority, Need, Timeline) as a starting point, moving to MEDDIC for more complex enterprise sales once BANT stops being enough. Tracking SQOs consistently gives you a real forecast instead of a wish list, plus a useful SQL-to-SQO conversion benchmark of 30 to 50%. The five-step qualification checklist, confirming a real conversation, the prospect’s own stated pain point, verified budget and authority, a confirmed timeline, and a locked-in next step, is usually enough to keep unqualified deals out of the pipeline in the first place.

    FAQ

    Is an SQO the same as a closed deal?

    No. An SQO just means the deal has been vetted and accepted into active pipeline with a real next step. It still has to go through the rest of the sales cycle, negotiation, proposal, and close, before it becomes revenue.

    Who decides when a lead becomes an SQO?

    Usually the account executive, since it’s their forecast credibility on the line. Some teams also require sales manager sign-off for larger deals.

    What’s the difference between SQO and a generic “opportunity” in my CRM?

    A generic opportunity might just mean someone booked a meeting. An SQO specifically means the deal passed formal qualification criteria like BANT or MEDDIC, not just that a conversation took place.

    Do small B2B teams really need this level of process?

    Yes, arguably even more than large enterprises. Small teams have less pipeline volume to absorb bad data, so one unqualified deal skewing your forecast is a much bigger percentage hit.

    Can marketing generate SQOs directly?

    Not typically. Marketing generates MQLs (marketing qualified leads) and sometimes SQLs, but the formal SQO qualification almost always requires a sales conversation and AE judgment call.
  • What Is Weighted Pipeline? A Beginner’s Guide

    What Is Weighted Pipeline? A Beginner’s Guide

    If you’ve ever watched a sales leader announce a huge pipeline number, then watched the quarter close way under target, you’ve seen the problem weighted pipeline is built to fix. Raw pipeline totals lie to you. They treat a deal that just had a first call the same as one that’s ready to sign, and that’s a recipe for false confidence.

    A weighted pipeline is a forecasting method that multiplies each open deal’s value by its probability of closing, then adds up those adjusted numbers. Instead of counting every deal at full value, it shows you what you’ll likely actually collect, based on how far along each opportunity really is.

    What Is a Weighted Pipeline, Exactly?

    Let’s back up and define a few terms first, since none of this makes sense without them. A sales pipeline is the list of open deals, called opportunities, that your reps are working, usually organized by stage, like “discovery,” “proposal sent,” or “contract negotiation.” A weighted pipeline takes that same list and adjusts it for reality.

    Instead of assuming every deal will close, it assigns each one a probability based on where it sits in your sales process, then multiplies that probability by the deal’s dollar value. Add up all those adjusted values and you get your weighted pipeline total.

    The core idea is that deals further along in the pipeline are more likely to close than deals that just started, so they should count for more in your forecast. A weighted sales pipeline recognizes that not every opportunity results in a sale, and assigns a value to each one based on its position in the sales process.

    How Is Weighted Pipeline Different from Unweighted Pipeline?

    An unweighted pipeline, sometimes just called “total pipeline,” adds up every open deal at its full value, no matter what stage it’s in. A brand-new $200K lead counts exactly the same as a $200K deal that’s about to sign.

    That’s obviously not how real sales works. An unweighted pipeline treats every deal as equally likely to close, whether you just made contact or they’re ready to sign, and that can lead to inflated revenue forecasts if the big deals don’t come through.

    Unweighted pipeline still has its uses. It’s fine for capacity planning or lead-gen targets, where you just want to know volume. But when it comes to forecasting actual revenue, weighted pipeline is the more honest number, because it adjusts for close probability instead of assuming everything lands.

    If you’re still fuzzy on how pipeline and funnel relate to each other, our post on sales pipeline vs. sales funnel breaks down that distinction in plain terms.

    How Do You Calculate Weighted Pipeline Value?

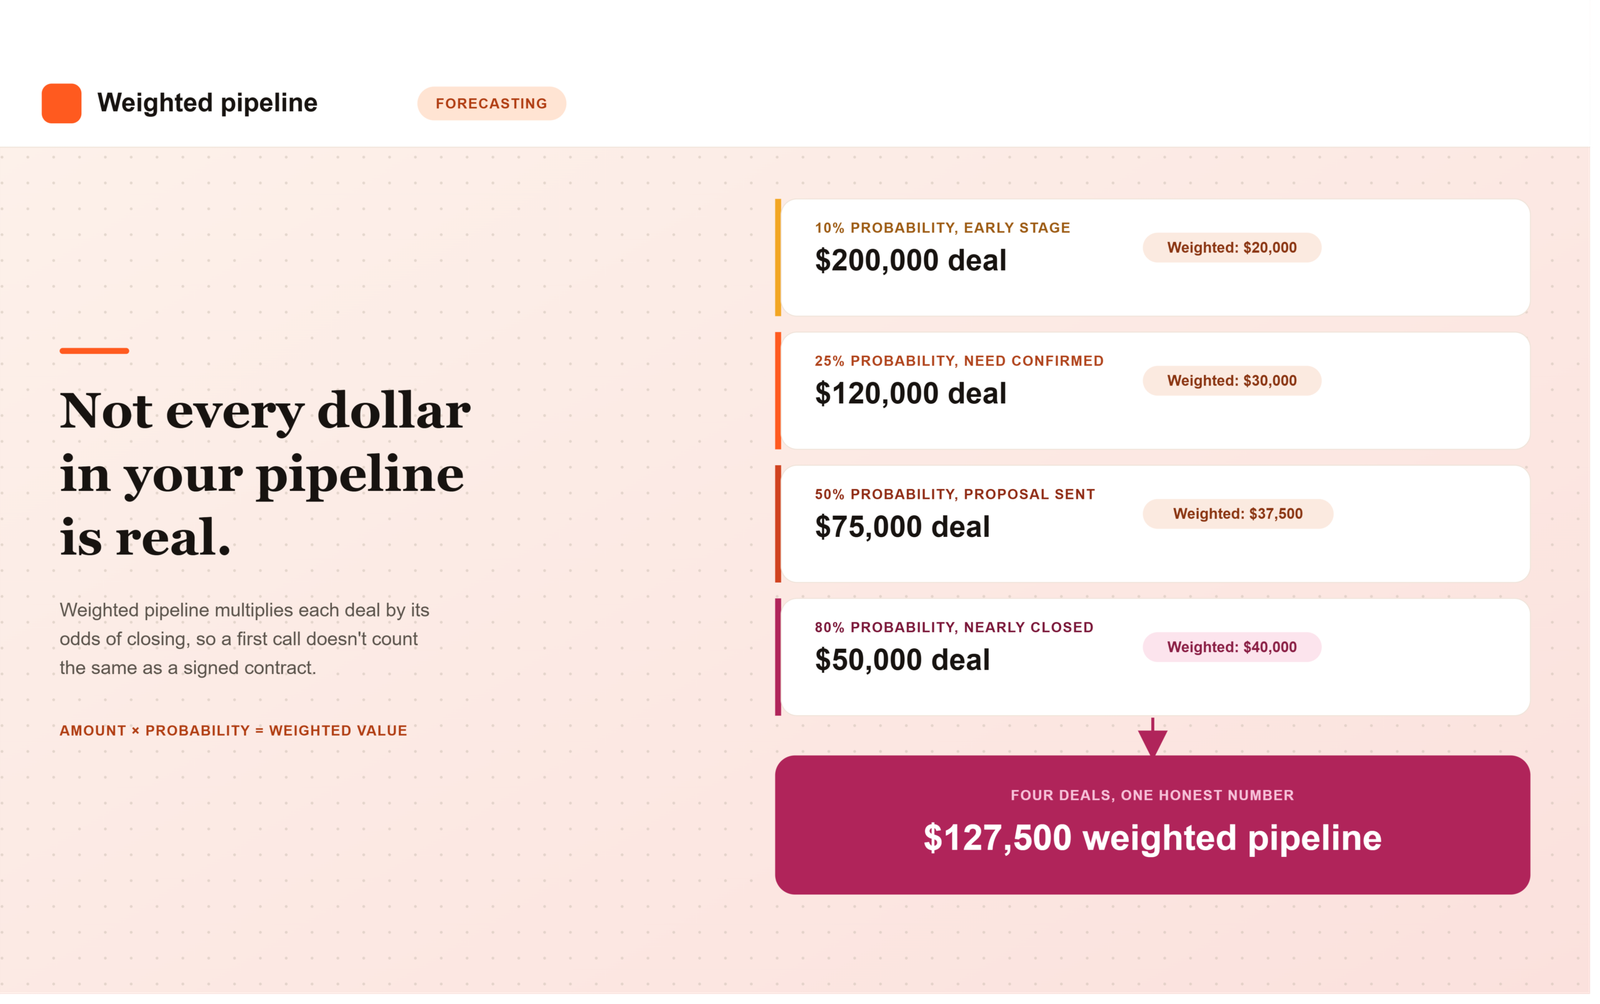
    The formula itself is simple, even if getting the inputs right takes some work. The standard formula is Weighted Pipeline = Deal Amount multiplied by Stage Probability, summed across every open deal.

    Here’s a worked example using four hypothetical deals at different stages: a $200K deal at 10% probability, a $120K deal at 25%, a $75K deal at 50%, and a $50K deal at 80%. Multiplying each deal by its stage probability and adding the results gives you a weighted pipeline of $127,500, which becomes a reasonable estimate of near-term new bookings.

    Here’s how to actually build this for your own team:

    1. Map your sales stages. Write out every stage a deal moves through, from first contact to closed-won.
    2. Assign a close probability to each stage, ideally based on your own historical conversion data rather than a guess.
    3. Multiply each open deal’s value by its stage’s probability to get that deal’s weighted value.
    4. Add up every weighted value across all open opportunities. That total is your weighted pipeline.
    5. Recalibrate regularly. A common recommendation is to compare your weighted forecast against what actually closed each quarter, then adjust your stage probabilities based on the gap.

    Pro tip: don’t hand-wave your stage probabilities. If you’re just guessing “discovery is 20 percent, proposal is 50 percent,” you’re not building a forecast, you’re building a nicer-looking version of a guess. Pull actual historical win rates by stage from your CRM. Even a simple lookback at the last four to six quarters of closed deals gives you a far more honest starting point than a probability borrowed from a template or a competitor’s blog post.

    Common Mistakes That Wreck a Weighted Forecast

    Weighted pipeline only works if the inputs behind it are trustworthy, and a few recurring mistakes quietly break that trust. The most common is letting stage probabilities go stale. A company sets them once during CRM setup and never revisits them, even as the sales motion, product, and market shift underneath those original assumptions.

    Another common issue is reps manually overriding probabilities on individual deals based on gut feel rather than actual stage movement. When that happens enough times across a team, the weighted total stops reflecting the sales process and starts reflecting whatever mood the pipeline review was in that week. A third mistake is applying the same probability curve across very different deal types, treating a small self-serve upgrade the same as a large multi-stakeholder enterprise deal, when the two rarely behave the same way as they move through a pipeline.

    Weighted Pipeline vs. Other Forecasting Approaches

    Weighted pipeline is one forecasting method among several, and most sales organizations end up using it alongside, not instead of, other approaches. A rep’s manual forecast category, commit, best case, pipeline, reflects human judgment about a specific deal. Historical trending looks at how deals of a similar size and type have converted in the past regardless of current stage. Weighted pipeline sits between the two: more systematic than a gut-feel forecast, more current than a purely historical trend line.

    More mature revenue operations software increasingly blends all three, layering rep judgment and historical win-rate data on top of stage-based weighting to produce a forecast that’s harder to game and easier to defend in a board meeting. If you’re evaluating a platform partly for its forecasting capability, our guide on what to look for in a B2B SaaS RevOps platform covers what native forecasting and reporting should actually look like before you sign a contract.

    Why Weighted Pipeline Matters Beyond the Sales Team

    Weighted pipeline isn’t just a sales reporting exercise. Finance uses it to model cash flow and hiring plans. Customer success and implementation teams use it to anticipate onboarding volume a quarter or two out. Marketing uses it to judge whether current pipeline generation is actually on pace to hit the number, rather than just counting raw leads.

    This is also where RevOps earns its keep. Someone has to own the stage probabilities, make sure they’re based on real historical data rather than assumption, and recalibrate them as the business changes. Get that ownership wrong, and every team downstream ends up planning against a number that looks precise but was never actually accurate to begin with.

    The Bottom Line

    Weighted pipeline exists because raw pipeline totals oversell certainty that doesn’t exist yet. By multiplying each deal’s value against a realistic probability of closing, it gives leadership a number that’s less exciting than the full pipeline total, but considerably more likely to actually show up in the bank account. The formula is simple. Getting the probabilities right, and keeping them honest over time, is the real work.

    Frequently Asked Questions

    What’s a good starting point for stage probabilities if we don’t have historical data yet?

    If you’re too new to have reliable historical win rates, start with a conservative curve, something like 10 percent for early discovery, 25 to 30 percent once a deal has a confirmed need, 50 percent at proposal, and 75 to 80 percent once verbal commitment is given. Treat these as placeholders and replace them with real data as soon as you have a few closed quarters to look back on.

    How often should we update our stage probabilities?

    Most teams review stage probabilities quarterly, comparing what the weighted forecast predicted against what actually closed. If a stage consistently over- or under-predicts close rates by a meaningful margin, adjust the probability rather than waiting for an annual planning cycle to fix it.

    Should every deal type use the same probability curve?

    Not necessarily. A small self-serve upgrade and a large multi-stakeholder enterprise deal often behave very differently as they move through a pipeline, so applying one universal curve to both can distort the forecast. Many teams build separate probability curves by deal size or segment once they have enough volume to support it.

    Can reps manually override a deal’s weighted probability?

    Some CRMs allow it, but it’s worth limiting how often this happens. If reps regularly override probabilities based on gut feel rather than actual stage progression, the weighted total stops reflecting your sales process and starts reflecting individual optimism or caution instead, which defeats the purpose of weighting in the first place.

    Is weighted pipeline the same thing as a sales forecast?

    They’re related but not identical. Weighted pipeline is one input into a forecast, a systematic, stage-based estimate. A full sales forecast often also incorporates rep judgment categories like commit and best case, along with historical trending, to produce a final number leadership actually commits to externally.

    Why does weighted pipeline matter to teams outside of sales?

    Finance uses it for cash flow and hiring plans, customer success uses it to anticipate onboarding volume, and marketing uses it to judge whether pipeline generation is actually on pace. Because so many teams plan against this number, getting the underlying probabilities right is a shared responsibility, not just a sales metric.

  • Sales Pipeline vs. Sales Funnel: What’s the Difference?

    Sales Pipeline vs. Sales Funnel: What’s the Difference?

    A sales pipeline tracks the specific deals your sales team is working and the actions reps take to move each one forward. A sales funnel tracks the broader flow of prospects and measures what percentage convert at each stage of the buyer’s journey. One is about your team’s activity; the other is about volume and conversion rates.

    If you’ve ever sat in a pipeline review and someone said “pipeline” when they meant “funnel” (or vice versa), you’re not alone. The two terms get used interchangeably all the time, even by people who’ve been in sales for years.

    But they’re not the same thing, and mixing them up can cost you. If you’re reporting funnel conversion numbers when your VP actually wants pipeline health, you’re going to have an awkward meeting.

    What is a sales pipeline?

    A sales pipeline is your sales team’s internal view of every active deal, organized by stage. Think of it as a dashboard showing exactly where each opportunity stands in your sales process, from first contact to closed won or closed lost.

    Each deal in your pipeline sits in a stage like “Qualified,” “Demo Scheduled,” “Proposal Sent,” or “Negotiation.” A sales pipeline outlines the steps that a sales team takes to turn prospects into paying customers, and it’s built around internal processes and actions, not the buyer’s mindset.

    That’s an important distinction. A pipeline stage moves forward because a rep did something (sent a proposal, booked a demo) or because the buyer took a specific, observable action, not because someone “felt good” about the call.

    What is a sales funnel?

    A sales funnel is a visual representation of your potential customers moving through various stages in their decision-making process, from the moment they become aware of your product to the moment they buy.

    While pipeline stages track individual deals, the funnel is volume-focused. It shows how your potential customer base narrows down as people drop off at each stage. Picture 1,000 leads entering at the top; by the time you get to signed contracts, you might have 8. That drop-off, stage by stage, is exactly what the funnel shows.

    Most funnels follow a simple structure: awareness, consideration, and decision, though many teams add more granular stages depending on their sales motion.

    Sales pipeline vs. sales funnel: what’s actually different?

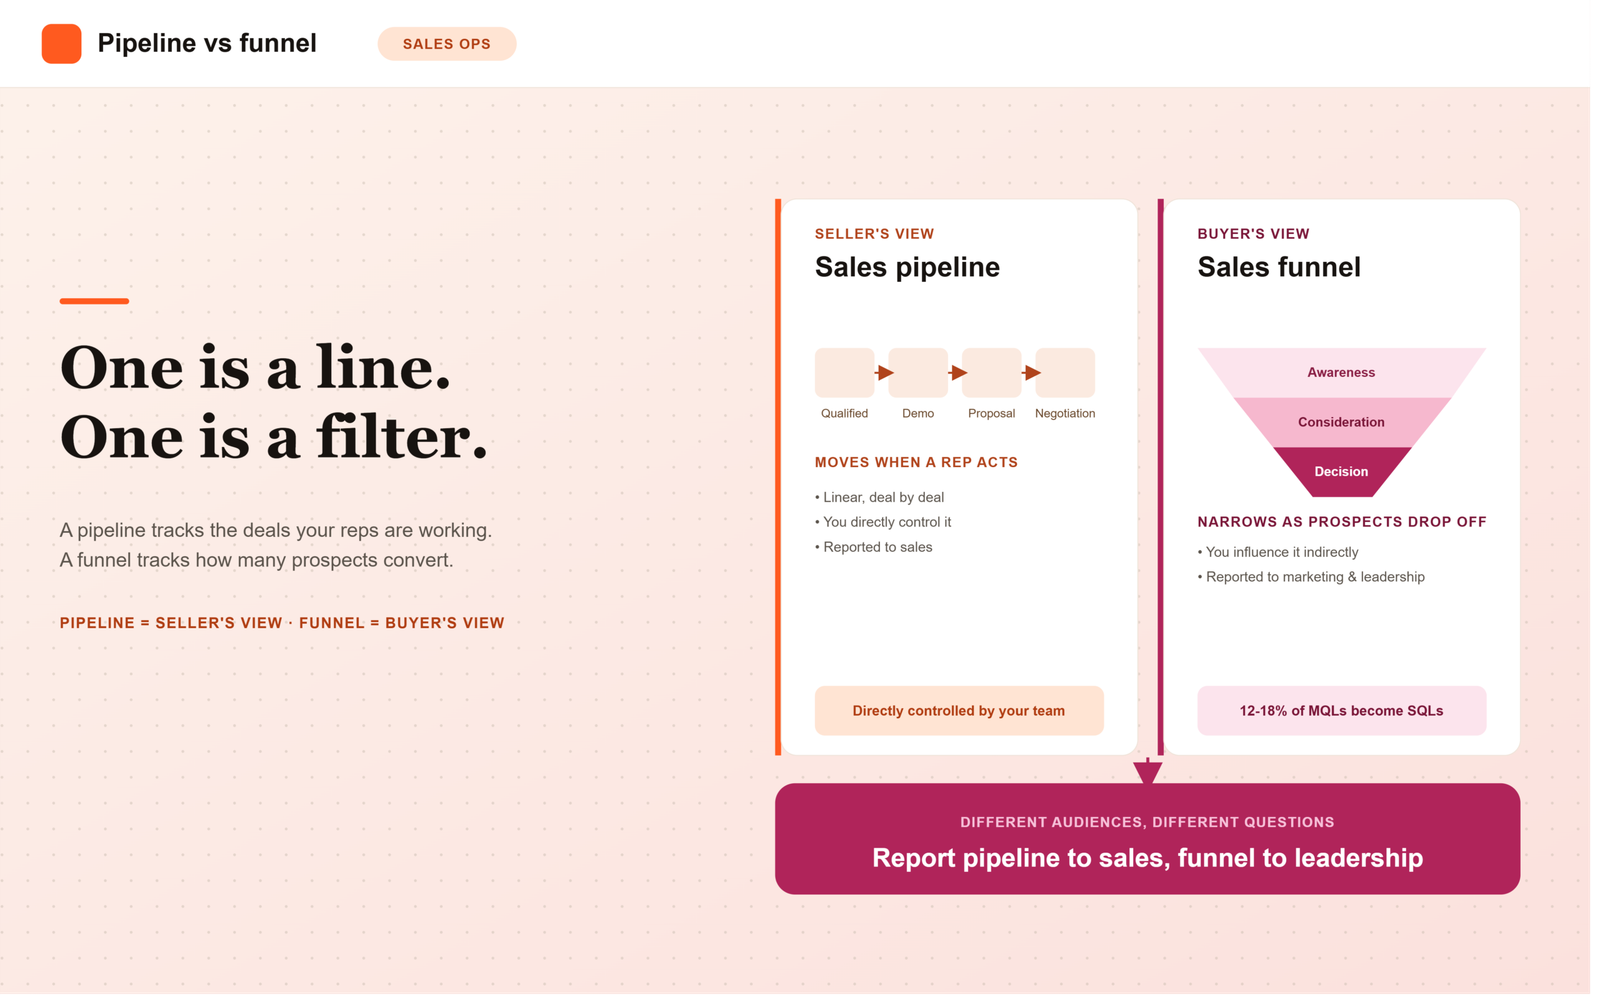
    Here’s the plain version. The pipeline focuses on the specific actions and stages a salesperson takes to move a deal forward (what the seller does), while the funnel represents the journey from the customer’s point of view, measuring conversion rates at each stage (what the buyer does).

    A few more ways to think about it:

    • Perspective: Pipeline = seller’s view. Funnel = buyer’s view.
    • Focus: Pipeline = individual deals and rep activity. Funnel = aggregate volume and conversion rates.
    • Shape: A pipeline is roughly linear (deals move stage to stage). A funnel narrows, because most leads drop off before they buy.
    • What you control: You can directly change your pipeline by adding or modifying sales tasks, but you can only influence your funnel indirectly, by improving lead quality and rep effectiveness.

    Honestly, most teams that struggle with forecasting aren’t struggling because they lack data. They’re struggling because they’re tracking pipeline activity but reporting it as if it tells them funnel-level conversion truth, and those are two different questions.

    Why does this distinction actually matter?

    It’s not just semantics. Pipeline data and funnel data answer different questions, and if you use the wrong one, you’ll draw the wrong conclusion.

    Say your VP asks why revenue is down this quarter. If you only look at the pipeline, you might see plenty of deals sitting in “Proposal Sent” and assume things are fine. But if you look at the funnel, you might notice conversion from lead to qualified opportunity has quietly dropped 30% over two months. That’s a top-of-funnel lead quality problem, not a closing problem, and you’d never catch it by staring at deal stages alone.

    This is also where the MQL-to-SQL handoff tends to break down. The biggest drop-off typically happens at the marketing-qualified-lead to sales-qualified-lead stage, where only 12 to 18% of MQLs actually become SQLs. If you’re not tracking that conversion rate specifically (a funnel metric), you won’t see the leak until it shows up as a pipeline shortage weeks later.

    Getting your pipeline stages right in the first place also feeds directly into forecasting accuracy, which is a topic we cover in more depth in our beginner’s guide to sales forecasting. And once your pipeline is clean, it’s worth checking whether you actually have enough of it. That’s where a pipeline coverage ratio comes in.

    How to use both without confusing your team

    Here’s a simple checklist for keeping the two straight:

    1. Name your pipeline stages around buyer actions, not seller effort. “Demo completed” is a better stage than “followed up.”
    2. Track funnel conversion rates separately from pipeline volume. Know your lead-to-MQL rate and MQL-to-SQL rate as distinct numbers.
    3. Report pipeline health to sales; report funnel conversion to marketing and leadership. Different audiences, different questions.
    4. Review both weekly. A healthy pipeline with a shrinking funnel is a warning sign your future pipeline is about to dry up.
    5. Keep your CRM as the single source of truth for both, so stage definitions don’t drift between what marketing calls a “lead” and what sales calls a “prospect.”

    Pro tip: if two people on your team can’t agree on what counts as an “opportunity” moving into the pipeline, fix that definition before you build any funnel or pipeline report. Every number downstream depends on it.

    FAQ

    Are sales pipeline and sales funnel the same thing?
    No. They describe the same general process (turning a prospect into a customer) but from different angles: the pipeline is the seller’s view of deal stages, and the funnel is the buyer’s view of conversion volume.

    Which one should I use for forecasting?
    Your pipeline is the primary input for forecasting, since it tracks the dollar value and stage of every open deal. The funnel helps you sanity-check that forecast by showing whether enough new opportunities are entering the top to sustain it.

    Can a small sales team skip the funnel and just track the pipeline?
    You can, but you’ll be flying a bit blind on lead quality. Even a rough funnel view (how many leads turn into qualified opportunities) helps you catch problems before they hit your pipeline.

    Do pipeline stages have to match funnel stages?
    Not exactly. The stages can overlap, but the pipeline is about what the deal needs next, while the funnel is about how many prospects are dropping off between stages. Some teams map them side by side, and that’s fine as long as everyone knows which report answers which question.

    What CRM feature actually shows the difference?
    Most CRMs display pipeline as a deal-stage board or Kanban view, and funnel data as a conversion report or drop-off chart. If your CRM only shows one of these, you’re missing half the picture.

  • Pipeline Coverage Ratio: Formula & Benchmarks Explained

    Pipeline Coverage Ratio: Formula & Benchmarks Explained

    What Is Pipeline Coverage Ratio? A Beginner’s Formula and Benchmarks

    Pipeline coverage ratio compares the total value of your open sales opportunities to your revenue target for a given period. You calculate it by dividing total pipeline value by your quota, and the result tells you whether you have enough deals in play to realistically hit that number.

    If you’ve ever sat in a forecast call and heard someone say “we’re at 3x coverage, we’re fine,” you’ve bumped into this metric already. But that single number hides more than it reveals, and most teams lean on it without understanding what’s actually driving it.

    Let’s fix that.

    What Is Pipeline Coverage Ratio?

    Pipeline (your sales pipeline) is the collection of open deals your sales reps are actively working, tracked in your CRM (customer relationship management software, the system that stores your deals and contacts). Pipeline coverage ratio takes the total dollar value of that pipeline and compares it against your revenue target.

    A sales pipeline coverage ratio compares the value of qualified opportunities in a defined period with the quota for that same period, answering a simple question: do you have enough real pipeline to hit your number this quarter or year? It’s not asking whether pipeline exists. It’s asking whether enough of it exists.

    How Do You Calculate Pipeline Coverage Ratio?

    The formula is genuinely simple, even if the inputs behind it aren’t. Pipeline Coverage Ratio equals Total Qualified Pipeline Value divided by Revenue Target, and a $1.5M pipeline against a $500K quarterly quota works out to 3x coverage.

    Here’s what that means in plain terms: if your team has $3 million in open pipeline and a $1 million quota, your coverage ratio is 3x, and you’d need to close about one out of every three dollars sitting in that pipeline to hit your number.

    The tricky part is what counts as “pipeline.” Only qualified opportunities that are actively being worked should count, not every stale lead sitting in a CRM stage with a dollar sign attached.

    What’s a Good Pipeline Coverage Ratio?

    There’s no single universal answer here, and honestly, anyone who hands you one flat number without asking about your win rate is giving you a guess dressed up as a benchmark. That said, the research does point to some useful ranges.

    Most sales experts recommend maintaining coverage between 3x and 6x your target, depending on your industry and conversion rates. Broken down by segment, enterprise sales teams typically maintain 3-5x coverage to account for longer sales cycles and multiple stakeholders, while mid-market B2B teams often target 2.5-4x coverage, and high-velocity SMB sales may operate effectively with 2-3x coverage.

    Those ranges roughly line up with what other pipeline-management resources report too: different segments need different coverage ratios, with enterprise deals needing 4:1 to 6:1 coverage because of longer cycles and lower win rates, mid-market landing around 3:1 to 4:1, and SMB comfortably running 2:1 to 3:1 thanks to faster decisions.

    Why Your Win Rate Matters More Than the Ratio Itself

    This is the part most beginner explanations skip, and it’s the part that actually matters. Your required coverage ratio is the mathematical inverse of your win rate: if your team closes 20% of opportunities, you need 5x pipeline to reliably hit target, and applying a generic 3x benchmark without adjusting for your actual conversion rate is one of the most common forecasting errors revenue leaders make.

    Put another way, a 3x ratio only works if your team closes roughly one in three qualified deals. If your reps close 25%, you need 4x. If they close 33%, 3x is fine. It’s just math, but it’s math a lot of sales leaders skip because 3x is the number everyone’s heard before.

    Pro tip: before you set a coverage target, pull your team’s actual win rate from the last two to four closed quarters and divide 1 by that number. That’s your real required coverage, not the industry rule of thumb.

    Weighted vs. Unweighted Pipeline Coverage

    You’ll also hear people talk about “weighted” pipeline. Unweighted coverage sums all deal values at face value, while weighted coverage typically adjusts each deal’s value by its probability of closing based on its current stage.

    Tracking both gives you a fuller picture: unweighted coverage shows volume, weighted coverage shows likelihood, and together they show you most of what you need to know about pipeline health.

    How to Calculate Your Pipeline Coverage Ratio: A Quick Checklist

    1. Pull your revenue target for the period (monthly, quarterly, or annual).
    2. Filter your CRM to only qualified, actively-worked opportunities, not every open record with a dollar value attached.
    3. Sum the total value of that filtered pipeline (unweighted), and optionally calculate a stage-weighted version too.
    4. Divide total pipeline value by your revenue target.
    5. Compare that ratio against 1 divided by your team’s historical win rate, not just a generic 3x or 4x rule.
    6. Recheck weekly. Coverage at the start of a quarter is a much better predictor of the outcome than coverage checked halfway through.

    Common Mistakes That Skew the Ratio

    The biggest one? Counting deals that were never real to begin with. Most teams inflate their coverage by counting everything in the CRM that has a dollar amount, which produces a comforting ratio that can turn into a missed quarter once you realize a big chunk of that pipeline was never going to close.

    The other common mistake is mismatching your measurement window to your sales cycle. If your typical deal takes 90 days to close, measure coverage against the current quarter. If it takes six months, you need to look two quarters out, otherwise you’re comparing pipeline that can’t possibly close in time against a target that assumes it will.

    Sound familiar? If your forecast calls keep producing surprises, there’s a decent chance your coverage math and your sales cycle length aren’t talking to each other.

    FAQ

    What’s the difference between pipeline coverage and pipeline velocity?
    Coverage tells you if you have enough total pipeline value to hit a target. Velocity measures how fast deals move through your funnel and translates into revenue over time. They’re related, but coverage is a snapshot and velocity is a rate.

    Is a higher pipeline coverage ratio always better?
    Not necessarily. A very high ratio can just mean your CRM is full of stale or unqualified deals nobody’s actually working, which looks reassuring on a dashboard and means nothing in practice.

    How often should we check our pipeline coverage ratio?
    Weekly, at minimum, especially heading into the final month of a quarter. Coverage measured at the start of a period predicts the outcome far better than a mid-quarter check-in.

    Does pipeline coverage ratio differ by industry?
    Yes. Enterprise software teams often target higher multiples than transactional or high-velocity SMB sales teams, mainly because win rates and sales cycle lengths differ so much between the two.

    What’s the single biggest mistake teams make with this metric?
    Treating 3x as a universal safe number instead of calculating what their own win rate actually requires. It’s an easy fix once you know to do it.

    Want the Full Pipeline Health Checklist?

    If you’re new to tracking pipeline metrics, don’t try to memorize every ratio and formula at once. Sign up for Revlyn’s newsletter and we’ll send you a practical pipeline health checklist you can run through with your team this week, no CRM overhaul required.